Key takeaways:
- GFC issues were about subprime mortgages and CDOs, not broad securitization: from a securitization perspective, the key issues were in the collateral - concentrated in subprime mortgage securitization - together with excessive leverage, and misaligned interests.
- CLOs are not CDOs: CLOs hold senior secured loans to operating businesses, with higher recovery rates compared to subprime mortgages. They are diversified and transparent – contrasting sharply with pre-crisis CDOs.
- Resilient then, stronger now: most sub-asset classes of securitized credit were resilient through the GFC, and wide-ranging reforms – stronger underwriting, leverage limits, and enhanced transparency – have further strengthened the asset class more broadly, now a $5 trillion market globally.
It is understandable that some investors approach securitized credit with caution. The asset class became shorthand for the 2008 global financial crisis (GFC), and this memory lingers in some client conversations more than a decade and a half later.
The epicentre of the crisis was in the US housing market, specifically subprime or A-line lending, amplified via a specific form of re-securitization known as CDOs and misaligned interests. Importantly, the collateral level practices and conditions that caused the crisis have been fundamentally addressed, whilst the structures that failed then are not what investors buy today.
We believe the evidence supports conviction, not caution.
What actually went wrong in 2008?
From a securitization perspective, the GFC-era issues were caused by a specific set of practices in one specific part of the securitized credit universe, not securitization itself. This was primarily within US subprime lending and its securitizations. These practices included:
- Deterioration in mortgage underwriting standards – this was the root cause, as loans were extended to borrowers who could not service their debt once teaser rates reset, often with little documentation or verification of income.
- Opaque synthetic structures – instruments such as CDO-squared re-securitized credit risk rather than diversifying real collateral. This increased leverage and magnified exposure to the US housing market in particular, making it extremely difficult for investors to assess underlying loan quality.
These two practices were compounded by a misalignment in interests. ‘Originate to distribute’ practices to mortgage issuance – where lenders could sell loans on without holding the risk – eroded incentives to screen borrowers. Meanwhile, the opacity of the CDO structures masked this deterioration in lending standards and acted as an amplification mechanism.
What are collateralized debt obligations (CDOs)?
CDOs were a broad category of securitization long associated with the GFC. These included a wide range of collateral types, typically mortgage-backed securities, and notably subprime mortgages.
These structures pooled and re-securitized credit risk using correlation assumptions that ultimately proved catastrophically wrong. When housing prices fell, defaults surged simultaneously across the entire portfolio, overwhelming the thin equity cushions designed to protect senior tranches.
CDO-squared was an additional, more complex structure which essentially pooled the cashflows from standalone CDOs and was often even more opaque.
None of these structures are present in the same format in the marketplace today, due to the risks they ultimately exposed, and the post-crisis regulatory changes which we discuss in more detail below.
The critical distinction: CLOs are not CDOs
CLOs – collateralized loan obligations – are a sub-asset class of securitized credit, but can be confused with CDOs. Whilst the acronyms and tranching method may appear similar, this is where the comparison ends.
The differences between these structures in terms of collateral quality, management approach, as well as diversification and transparency are profound.
Collateral quality: CLOs hold senior secured loans to operating businesses, with first-lien claims on company assets. Recovery rates are also typically higher when compared with subprime mortgages. This fundamental difference in collateral quality provides a critical safety margin that CDOs lacked. Indeed, no AAA-rated CLO has ever taken a loss.
Diversification and transparency: a typical CLO holds 150–300 loans across multiple industries, with concentration limits. In addition, loan-level disclosure replaces the opacity of pre-crisis CDOs.
The resilience of securitized credit in the GFC
The types of securitized credit in the market today are collateral-backed securitized credit – CLOs, ABS, RMBS and CMBS – all of which securitize real, diversified loan pools.
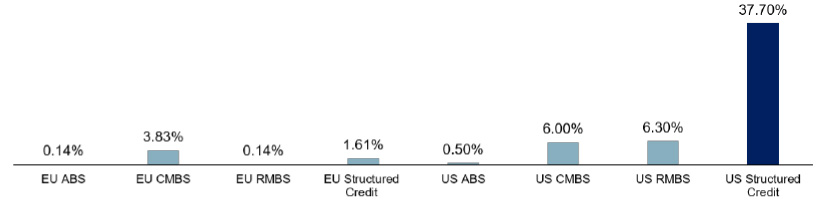
The GFC performance record reflects the distinction with CDOs and CDO-squared quite starkly. As figure 1 illustrates, the cumulative loss rates from pre-GFC issued bonds were generally low for most securitized credit sub-sectors. European securitized credit defaults were low across all markets, and most US markets were also resilient. By contrast, US structured credit saw far steeper losses, and the vast majority of GFC structured credit losses were in CDOs linked to subprime mortgages, not CLOs.
Figure 1: pre-GFC issued bonds: cumulative loss rates by asset class and region
Source: RBC BlueBay Asset Management, Fitch Ratings, S&P, Moody’s. This is not a recommendation to buy or sell a particular security. There is no assurance that any of the trends depicted or described herein will continue. Note: Global Corporates Default data is based on 10-year default performance of the 2007 Moody’s rating vintage.
Crucially, this resilience was not unique to CLOs. Across European securitized credit broadly, historical default rates have been lower than those experienced in similarly rated corporate credit – a record that holds across the major sub-asset classes, not just one corner of the market (figure 2). Pre-GFC issued CLOs, known as CLO 1.0, also recorded substantially lower defaults than global corporate credit through the crisis.
Figure 2: default performance through the GFC: CLO 1.0 recorded substantially lower defaults than global corporates

Source: RBC BlueBay Asset Management, Fitch Ratings, S&P, Moody’s. This is not a recommendation to buy or sell a particular security. There is no assurance that any of the trends depicted or described herein will continue. Note: Global Corporates Default data is based on 10-year default performance of the 2007 Moody’s rating vintage.
The structures that failed are no longer present in the same format. The structures that proved resilient are what investors buy today.
What has improved since the GFC?
Underwriting
|
- Stronger standards imposed at loan issuance stage.
- Risk retention requirements imposed: loan originators retain an economic interest, aligning their interests with those of investors.
|
Leverage and funding
|
- Leverage limits imposed on securitized structures.
- Reduced reliance on short-term wholesale funding, addressing the liquidity mismatch that left pre-crisis institutions unable to refinance assets when funding markets seized.
|
Transparency
|
- Loan-by-loan disclosure.
- Regular reporting of holdings.
|
Structure
|
- Simpler, collateral-backed structures underpinned by diversified loan pools.
- Elimination of synthetic re-securitizations such as CDO-squared, which magnified rather than diversified risk.
|
Credit enhancement
|
- Subordination in some cases doubled.
|
Ratings and due diligence
|
- Overhauled methodologies.
- Mandatory due diligence for institutional investors.
|
Source, RBC BlueBay Asset Management, November 2026
Why this matters today
Memory of the GFC-era can invoke a sense of caution in many investors, and the heightened macroeconomic and geopolitical uncertainty in markets today naturally keeps us alert to potential risks.
However, the corner of structured credit that failed in the GFC was fundamentally different from the securitized credit market that exists today. The collateral-level practices have changed, and the structures that amplified the crisis no longer exist in the same format. Indeed, the broader securitized credit asset class, which has grown to $5 trillion globally, was resilient through the GFC, with European securitized credit defaults remaining low across all markets, and historically below similarly rated corporate credit.
Not only this, but the wide-ranging reforms and regulatory changes implemented since then have, in our view, only enhanced this resilience. We believe this is a completely different asset class that warrants a second look.