There are several misconceptions of EMD that exist. To help investors make a more informed decision, we explore the reality behind the myths.
Myth 1: EMD is a niche asset class.
Reality: At $29 trillion1, emerging market debt dwarfs many other fixed income asset classes.
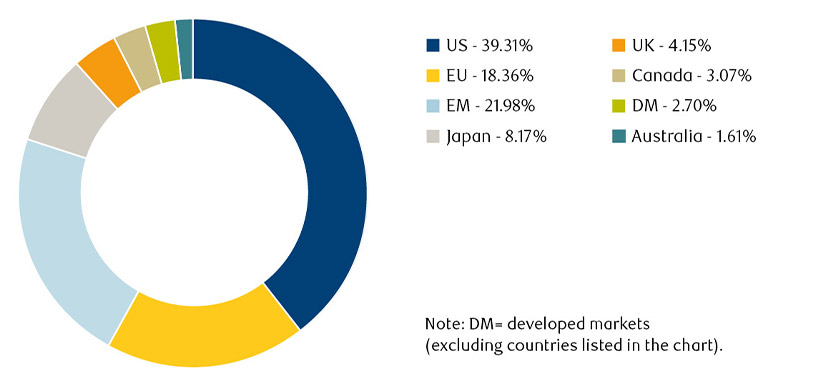
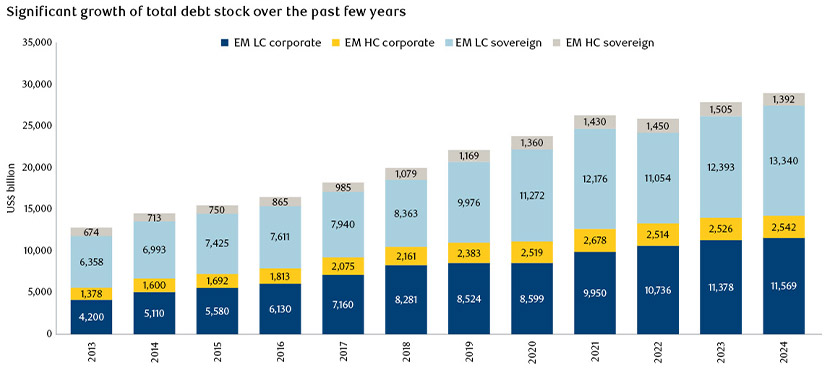
When investors hear EMD, many think small and niche. This is not the case. EM debt has become the largest pool of credit in the world, according to the Bank for International Settlements, surpassing the US over the past decade. Some people may be surprised to learn that the total market size is over $29 trillion in total debt, as of 31 October 2024, according to the Institute for International Finance.
To put that into perspective, the size of the US High Yield market is roughly $3 trillion2 and the US Investment Grade (IG) market is about $8 trillion3. These are both very mainstream asset classes that often form large parts of client portfolios, yet both are dwarfed by EMD.
Figure 1: Global fixed income market outstanding
Source: Bank of International Settlements (BIS)
Significant market growth demonstrates the growing importance of EMD
Over the past decade, the EM asset class has more than doubled in size (see Figure 2). The overall expansion highlights the deepening and maturing of EMD and the growing presence of EM countries and corporations, as they have increasingly turned to global markets to raise capital. It is worth noting, however, that this is not simply due to the largest countries and companies issuing more and more debt.
In fact, the growth is being driven by a widening range of market participants becoming more integrated into global capital markets. Moreover, because of the size and breadth of maturity profiles within issuers’ yield curves, investors can access deep, liquid markets with a broad choice of individual instruments for their investment objectives.
Figure 2: Evolution of the EM debt stock
Source: JPMorgan, as at 31 December 2024.
Myth 2: Higher yields in EMD signify lower credit rating.
Reality: EMD has an investment grade rating, on average.
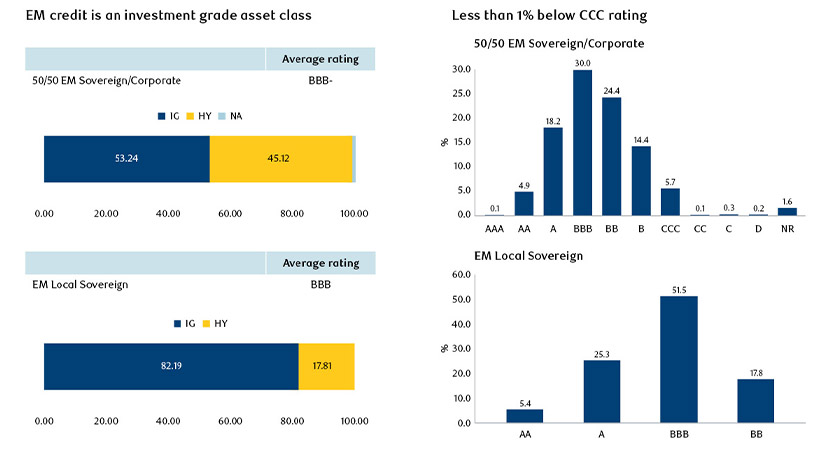
Investors may be surprised to know that, on average, the EMD asset class has an investment grade rating. The narrative seems to be that it is inherently more risky and poorly rated, but that is simply not the case.
Because of the geographical breadth of the asset class, various headlines, often pertaining to a small component of the index, can dominate perceptions of the overall asset class. As a result, emerging markets have, at times, been cast in shadows by investor apprehension. Whilst this dynamic can create opportunities, it can also make investors who are unfamiliar with the asset class reluctant to dip their toes into the market.
Indeed, supported by robust reserves and strong financial discipline, emerging markets creditors have developed mechanisms to address market fluctuations, revealing their strategic strength when it comes to meeting funding requirements. EMD default rates are lower, and recovery rates are higher than for developed markets, challenging the notion that it’s a riskier financial frontier.
Of course, there is a broad range of credit quality in the market, as shown below, providing ample opportunity for active investors to uncover opportunities.
Figure 3: EM credit is an investment grade asset class
Source: RBC Global Asset Management and Bloomberg as of 31 December 2024.
Myth 3: Emerging markets are inherently risky, so stay away.
Reality: Emerging markets demonstrate stronger fundamentals than developed markets.
There will always be some emerging market headlines that make the front page of the Wall Street Journal or the Financial Times. But for every one or two stories that make headlines for all the wrong reasons, there are another 80+ countries that do not, given the breadth of the market. These countries are generally fundamentally sound and on an upward trajectory, make good investments and paying attractive levels of yield relative to the risks.
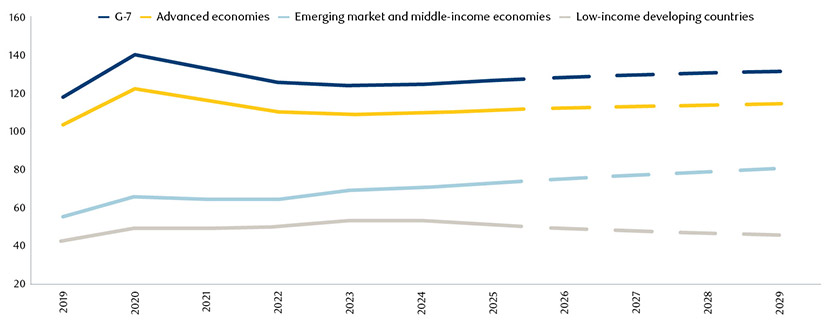
Contrary to the historical norm, emerging market sovereigns showcase strong fundamental economic metrics compared to developed markets countries and represent a fast-growing share of global GDP. While developed markets grappled with a higher debt-to-GDP ratio of 126.5%, emerging markets had a moderate 69.4% debt-to-GDP ratio, on average (Figure 4). Emerging market fundamentals also look compelling relative to developed markets across a range of additional metrics, including fiscal deficits and current account deficits.
Figure 4: General government gross debt (% of GDP)
Source: IMF projections as of October 2024
Despite global challenges in recent years, such as supply chain disruptions, inflationary pressures, and geopolitical uncertainties, EM economies have demonstrated healthy resilience. Many EM countries have implemented sound fiscal and monetary policies over the last few years, building stronger macroeconomic foundations that will lower gross financing needs (Figure 5).
Figure 5: Gross financing needs 2024 (% of GDP)
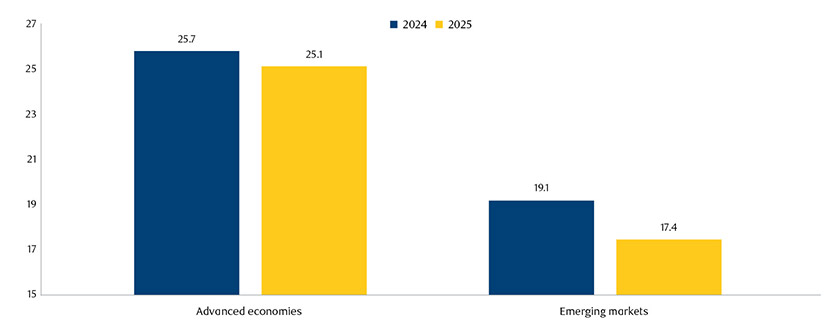
Source: IMF projections as at December 2024. Weighted average GFNs for advanced economies and emerging markets. GFNs are defined as the sum of the primary deficit, debt service, and the stock of short-term debt at the end of the previous period, plus other debt-creating or reducing flows.
As a result, we have seen a decisively positive trend in EM sovereign ratings recently (Figure 6).
Figure 6: A positive trend in EM sovereign ratings
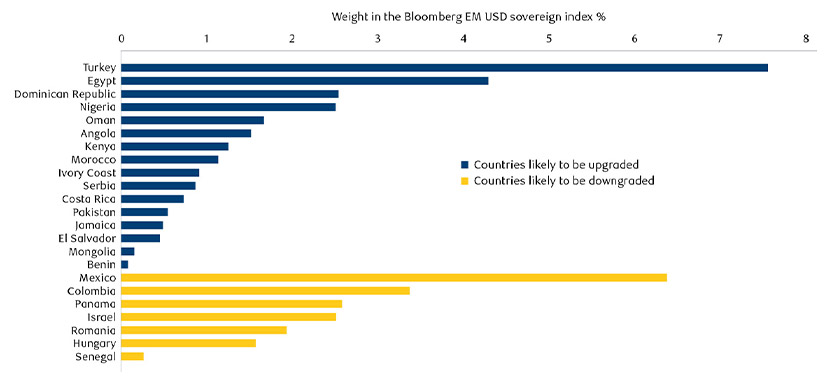
Source: Barclays Research. The chart shows countries that are expected to receive at least one rating upgrade/downgrade by any of the three major rating agencies up to year-end 2025. Default/ recent restructuring situations excluded. Please note that El Salvador was updated as of 7 January 2025. The foreign currency debt rating was upgraded by Fitch to B-, making it the equivalent of B- across all major rating agencies.
In addition, EM corporates entered 2025 from a position of strength. The high default rates of the post-Covid era, which were largely driven by the Chinese property crisis along with a steady stream of negative geopolitical events, are now behind us, with EM corporates going through a sharp de-leveraging event as a result. We expect corporate defaults to be in line with US markets and meaningfully lower than Europe.
Conclusion
EMD is a huge and established asset class that can offer enhanced yields, diversification and excess returns. That's why we believe it should form part of any core bond portfolio. However, EMD shouldn't be treated homogeneously and investors need specialised expertise to manage assets effectively in this asset class.
1, 2, 3 JPMorgan, RBC BlueBay Asset Management, as of December 2024.
Helping you better understand emerging market debt