Ideas principales:
- Los riesgos de inflación a corto plazo apuntan claramente al alza: las crisis de oferta, especialmente en lo que se refiere a la energía y los alimentos, y la fuerte demanda de semiconductores están provocando un aumento de la inflación general. Sin embargo, el moderado crecimiento de los costes laborales unitarios, de la renta personal, de la oferta monetaria y del crédito parece indicar que aún estamos muy lejos del régimen de inflación que vivimos en la década de 1970.
- A medio plazo, la inteligencia artificial podría tener un impacto desinflacionista: si la inteligencia artificial provoca un aumento de la productividad, podría aportar un importante impulso positivo por el lado de la oferta y contribuir a mantener en niveles reducidos tanto los costes laborales unitarios como la inflación. Si dicho aumento de la productividad viene acompañado de una pérdida neta de empleo, su efecto podría llegar incluso a ser deflacionista.
- La respuesta política será clave, especialmente a corto plazo. Los inversores deben prestar atención a cómo evolucionan los riesgos para la inflación en los distintos horizontes temporales: la inflación y los tipos de interés podrían subir a muy corto plazo y caer con fuerza a medio plazo. A largo plazo, su evolución dependerá de la interacción entre la inteligencia artificial, el contexto demográfico, la deuda y la respuesta de las políticas fiscal y monetaria. Los inversores no deben perder de vista los riesgos alcistas a corto plazo, los riesgos a la baja a medio plazo ni la gran variedad de escenarios posibles a largo plazo. Será esencial reaccionar con rapidez a esta evolución de los riesgos.
Últimamente, varias personas me han preguntado si, en lo que respecta a la inflación, estamos volviendo a una situación similar a la que vivimos en la década de 1970. En un contexto marcado por el nuevo encarecimiento de la energía como consecuencia de la guerra de Irán, por el impacto de un verano de calor extremo sobre la producción de alimentos, que podría además agravarse con un episodio de El Niño de intensidad histórica, y por el fuerte crecimiento de la inversión en inteligencia artificial, es comprensible que los inversores estén centrando ahora su atención en los riesgos al alza para la inflación.
Es cierto que existen ciertas similitudes entre el contexto actual y el de la década de 1970. Pero también hay algunas diferencias importantes. En particular, hemos de tener especialmente en cuenta el posible aumento de la productividad que podría traer consigo la inteligencia artificial. Por lo tanto, aunque la inflación y los tipos de interés podrían repuntar a corto plazo, no parece probable que nos encaminemos a un entorno inflacionista como el que vivimos en la década de 1970. En este artículo me centraré en Estados Unidos, aunque, a la hora de analizar las perspectivas de inflación en otros países, conviene examinar la evolución de esos mismos indicadores en cada mercado.
De unas condiciones de oferta favorables a un entorno más adverso
Durante buena parte del periodo transcurrido desde principios de los años ochenta, la globalización y, en particular, la incorporación de la enorme población china a la fuerza laboral de la economía capitalista mundial, generaron un importante impulso positivo por el lado de la oferta que contribuyó a contener la inflación. La revolución energética del esquisto representó también otra mejora significativa de las condiciones de oferta.
Sin embargo, al igual que en los años setenta, la década de 2020 se ha caracterizado hasta ahora por una sucesión de crisis de oferta: primero la pandemia de covid, después la invasión rusa de Ucrania y, ahora, la guerra con Irán. A ello se suma el creciente riesgo que plantean para la oferta de alimentos las alteraciones relacionadas con el clima, a medida que las temperaturas van aumentando en todo el mundo. Estas tensiones sobre la producción de alimentos se producen, además, en un contexto de restricciones en el suministro de energía y fertilizantes derivadas del conflicto en Oriente Próximo.
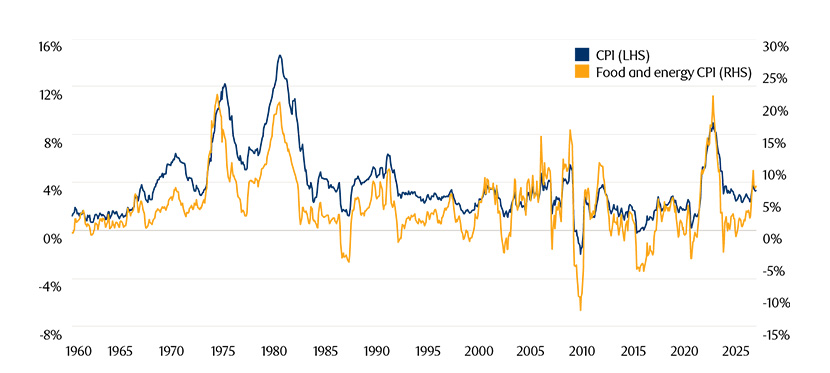
Los precios de la energía ya han subido con fuerza, y también es probable que asistamos al encarecimiento de los alimentos. El aumento de los precios de la energía y los alimentos casi siempre ha derivado en un incremento de la inflación general, como ya hemos visto desde el inicio de la guerra con Irán: la energía ya ha presionado al alza la inflación, y los precios de los alimentos podrían comenzar a hacerlo pronto.
Gráfico 1: El encarecimiento de los alimentos y la energía suele traducirse en un aumento de la inflación general
Fuente: Oficina de Estadísticas del Mercado Laboral de Estados Unidos, Macrobond, últimos datos disponibles a 22 de septiembre de 2026.
Para que el encarecimiento de los alimentos y la energía no acabara derivando en un incremento de la inflación general, la inflación subyacente tendría que desacelerarse de forma sustancial. No es algo que suela ocurrir, ya que, al menos en un primer momento, los consumidores pueden recurrir a sus ahorros o al crédito para hacer frente al aumento del coste de los alimentos y de la energía. Por tanto, la inflación subyacente no se modera de inmediato cuando suben estos precios, lo que hace que la inflación general aumente a corto plazo.
¿Una espiral de salarios y precios?
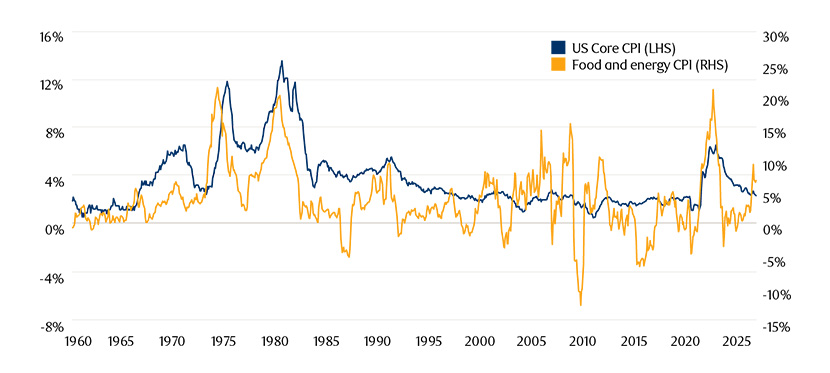
Sin embargo, lo que más preocupa a los bancos centrales es la posibilidad de que las tensiones de oferta acaben derivando en una inflación subyacente más elevada de manera persistente. El encarecimiento de los alimentos y la energía puede traducirse directamente en un aumento de la inflación subyacente. Por ejemplo, una subida de los precios de los alimentos puede terminar reflejándose en precios más altos en los restaurantes, como todos hemos podido comprobar en los últimos años. No obstante, el riesgo que los bancos centrales desean evitar a toda costa es que se desencadene una espiral salarios-precios o precios-salarios, según qué variable empiece a subir primero, que termine generando una inflación subyacente de carácter persistente. Con todo, conviene señalar que las tensiones negativas de oferta no siempre se traducen en un aumento significativo de la inflación subyacente, y mucho menos en uno duradero.
Gráfico 2: El encarecimiento de los alimentos y la energía no siempre deriva en un aumento de la inflación subyacente
Fuente: Oficina de Estadísticas del Mercado Laboral de Estados Unidos, Macrobond, últimos datos disponibles a 22 de septiembre de 2026
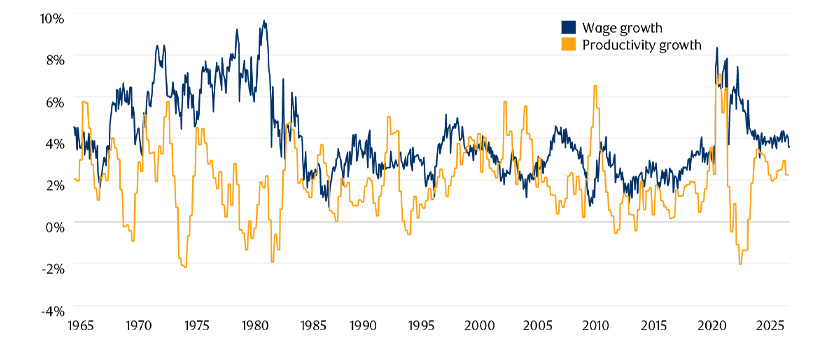
No cabe duda de que la evolución de los salarios es determinante para que la inflación subyacente se mantenga elevada durante más tiempo. En la década de 1970, el crecimiento salarial era elevado y se mantuvo en niveles elevados incluso durante las recesiones, lo que se debió en parte al peso de los sindicatos y a la existencia de mecanismos de ajuste salarial vinculados al coste de la vida. El crecimiento de los salarios se aceleró también en 2022, en un contexto marcado por una gran escasez de mano de obra y un fuerte aumento de las ofertas de empleo, cuando la demanda repuntó con fuerza tras la pandemia.
Gráfico 3: El crecimiento de los salarios no tiene por qué traducirse en una mayor inflación subyacente si el aumento de la productividad lo compensa
Fuente: Oficina de Estadísticas del Mercado Laboral de Estados Unidos, Macrobond, últimos datos disponibles a 22 de septiembre de 2026
Sin embargo, el crecimiento de los salarios no tiene por qué traducirse en una mayor inflación subyacente si el aumento de la productividad lo compensa. Si las empresas venden más bienes o servicios, pueden aumentar los salarios sin necesidad de subir los precios. Del mismo modo, si aumenta la cantidad de bienes y servicios disponibles, las subidas salariales no tienen por qué generar presiones al alza sobre los precios. En Estados Unidos, el crecimiento de los salarios no es especialmente elevado en estos momentos en relación con el aumento de la productividad.
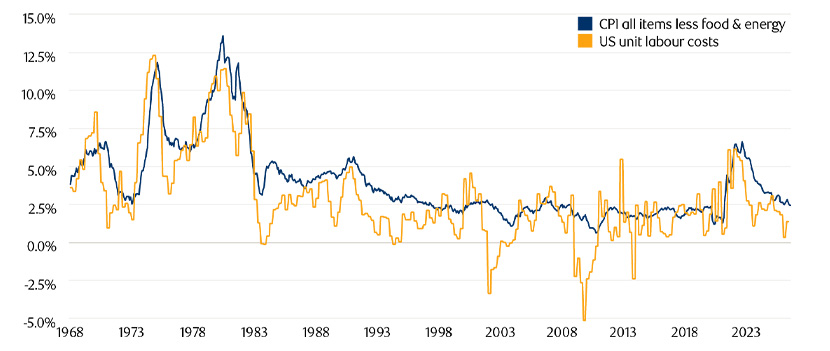
Al ajustar el crecimiento salarial por la evolución de la productividad se obtiene lo que se conoce como crecimiento de los costes laborales unitarios. Aunque estos costes podrían repuntar en respuesta a las recientes crisis de oferta y al aumento de la inflación general, no parecen apuntar a un problema significativo de inflación a largo plazo. La diferencia con los escenarios de los años setenta y de 2022 resulta evidente.
Gráfico 4: El crecimiento de los costes laborales unitarios es muy inferior al de la década de 1970
Fuente: Oficina de Estadísticas del Mercado Laboral de Estados Unidos, Macrobond, últimos datos disponibles a 22 de septiembre de 2026
Al analizar el crecimiento de los salarios y de los costes laborales unitarios, conviene tener en cuenta que una fuerte caída del salario real podría contribuir a provocar una recesión, a menudo en combinación con una política monetaria de orientación más restrictiva, lo que, en última instancia, podría tener efectos desinflacionistas a medio plazo.
La evolución del crédito no apunta a una inflación elevada de manera persistente
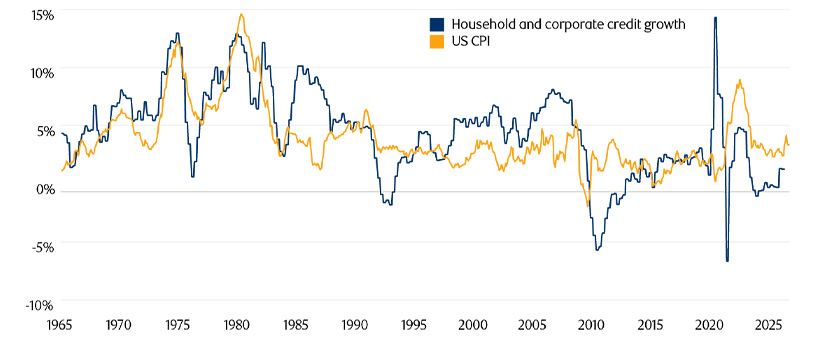
Buena parte del gasto y, por tanto, del crecimiento de la renta, se financia a través del crédito; de ahí que la diferencia entre el crecimiento del crédito y el crecimiento real de la economía guarde una estrecha relación con la inflación. Parte del crecimiento del crédito a los hogares termina trasladándose a los precios de la vivienda, algo que los indicadores de inflación no recogen plenamente, como ocurrió a mediados de los años ochenta, a finales de los noventa y durante la década de 2000, antes de la crisis financiera mundial.
Gráfico 5: Crecimiento moderado del crédito al sector privado en Estados Unidos
Fuente: Banco de Pagos Internacionales, Oficina de Estadísticas del Mercado Laboral de Estados Unidos, Macrobond, últimos datos disponibles a 22 de septiembre de 2026.
El débil crecimiento del crédito contribuye a explicar por qué el proceso de expansión cuantitativa que se puso en marcha tras la crisis financiera no derivó en un aumento importante de la inflación. Cuando el crédito se contrae, es preciso aumentar en cierta medida la cantidad de dinero para compensar esa caída. Lo importante es el equilibrio entre ambos factores.
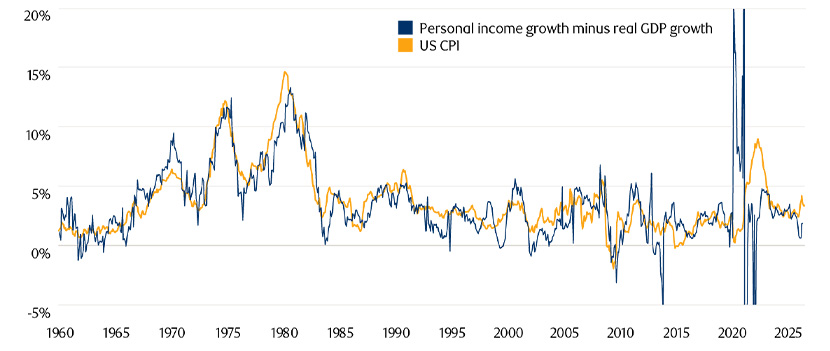
A diferencia de lo que ocurrió tras la crisis financiera mundial, la expansión cuantitativa que se puso en marcha durante la pandemia sirvió para financiar directamente medidas de estímulo de los gobiernos que llegaron a los consumidores y aumentaron de manera sustancial sus ingresos, también a través de ayudas directas. Cuando ese aumento de la renta se trasladó al consumo, contribuyó de forma significativa al repunte de la inflación. No cabe duda de que se necesitaban ciertas medidas de estímulo, pero la escala de dichas medidas fue excesiva.
Gráfico 6: El crecimiento de la renta personal, incluidas las ayudas públicas, influye en la inflación
Fuente: Oficina de Análisis Económico de Estados Unidos, Oficina de Estadísticas del Mercado Laboral de Estados Unidos, Macrobond, últimos datos disponibles a 22 de septiembre de 2026.
En la actualidad, el crecimiento del crédito al sector privado estadounidense sigue siendo relativamente moderado, pese a que las grandes tecnológicas que están invirtiendo en inteligencia artificial recurren al endeudamiento para financiar parte de sus inversiones en centros de datos. Esto está ejerciendo presión al alza sobre los precios de los semiconductores y de algunos de los productos electrónicos que los incorporan.
A corto plazo, por tanto, las nuevas tensiones de oferta vuelven a presionar al alza los precios de la energía y pronto podrían hacer lo mismo con los alimentos, mientras que el fuerte aumento del gasto de capital por parte de las tecnológicas está encareciendo los chips. Sin embargo, a medio plazo, el crecimiento relativamente contenido de los costes laborales unitarios, la evolución de la renta personal en relación con el crecimiento real de la economía y el crecimiento moderado del crédito parecen indicar que estamos aún muy lejos de volver a un régimen inflacionista como el de la década de 1970.
La ausencia de medidas de estímulo financiadas a través de programas de expansión cuantitativa y el hecho de que los hogares cuenten ahora con mucho menos margen para seguir reduciendo su tasa de ahorro disminuyen de manera significativa el riesgo de que volvamos a asistir a un episodio de fuerte aumento de la inflación como el que vivimos en 2021 y 2022. No nos parece muy probable que vayan a aprobarse nuevas medidas de estímulo fiscal antes o después de las elecciones legislativas de mitad de mandato que van a celebrarse próximamente en Estados Unidos. Sin embargo, y dadas las recientes declaraciones del gobierno estadounidense, conviene seguir de cerca esta posibilidad.
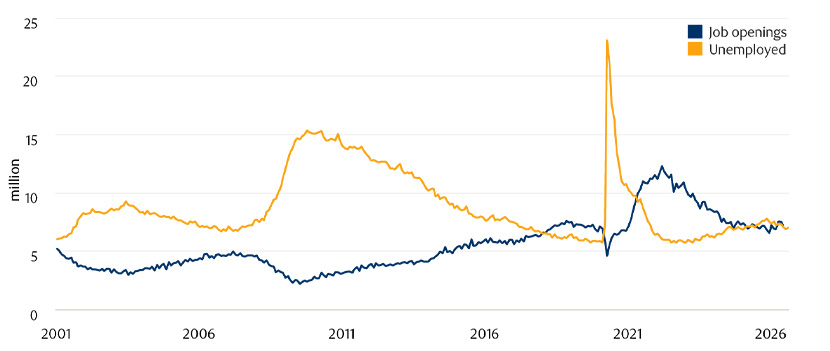
Un mercado laboral menos tensionado también reduce el riesgo de que los costes laborales unitarios registren un aumento tan acusado como el que observamos en 2022. Sin embargo, será importante seguir de cerca su evolución, ya que la escasez de mano de obra sigue siendo relativamente elevada, si bien el mercado laboral se ha relajado de forma significativa desde 2022.
Gráfico 7: El mercado laboral está menos tensionado que en 2022, aunque aún muestra una clara escasez de mano de obra
Fuente: Oficina de Estadísticas del Mercado Laboral de Estados Unidos, Macrobond, últimos datos disponibles a 22 de septiembre de 2026
Demografía e inmigración frente a inteligencia artificial
Al analizar las diferencias entre el momento actual y los episodios de inflación que vivimos en la década de 1970 y en 2022, también es importante tener en cuenta la evolución de la población activa y la inteligencia artificial.
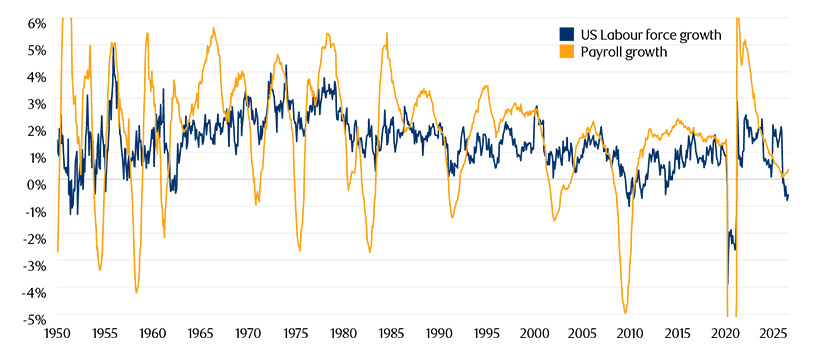
El crecimiento de la población activa (es decir, el número de trabajadores disponibles) ha entrado recientemente en territorio negativo, debido principalmente al envejecimiento de la población y a las medidas adoptadas en materia de inmigración. En un contexto en el que la economía está próxima a lo que la mayoría de las estimaciones consideran pleno empleo, resulta difícil que el crecimiento real de la producción supere al de la productividad. Considerada de forma aislada, esta dinámica podría generar presiones inflacionistas y, al mismo tiempo, hacer que el crecimiento real sea más vulnerable a las crisis de oferta.
Gráfico 8: La población activa no está creciendo como lo hacía en la década de 1970
Fuente: Oficina de Estadísticas del Mercado Laboral de Estados Unidos, Macrobond, últimos datos disponibles a 22 de septiembre de 2026
Sin embargo, en la realidad, estos factores rara vez actúan de forma aislada. Baste recordar que, durante el fuerte repunte de la inflación que se produjo en 2022, el empleo crecía con rapidez y eran pocos los que temían que la inteligencia artificial pudiera poner en riesgo sus puestos de trabajo.
La inteligencia artificial podría impulsar un fuerte aumento de la productividad. En caso contrario, lo más probable es que las compañías acabaran reduciendo drásticamente su gasto de capital, lo que podría provocar una recesión como la que tuvimos a principios de la década de 2000, cuando se produjo el estallido de la burbuja de las puntocom.
Supongamos, no obstante, que la inteligencia artificial sí se traduce en un aumento de la productividad, que parece la hipótesis más probable. En el escenario más favorable, este incremento de la productividad podría producirse sin una pérdida neta de empleo y permitir un aumento tanto de la producción real como de los salarios reales, manteniendo al tiempo los costes laborales unitarios y la inflación en niveles reducidos.
Sin embargo, también es posible que el aumento de la productividad permita a las empresas reducir sus plantillas. Si la caída del empleo superara a la reducción de la población activa, el consiguiente incremento del desempleo podría provocar rápidamente tensiones desinflacionistas, e incluso potencialmente deflacionistas.
En el pasado, las empresas han tendido a prescindir de trabajadores solo cuando sus beneficios comienzan a resentirse. Ahora, sin embargo, estamos viendo algunos casos en los que las empresas están reduciendo sus plantillas mientras invierten en inteligencia artificial, aunque sus beneficios siguen creciendo (aunque no ocurra lo mismo con el flujo de caja libre).
Por tanto, los inversores no deberían infravalorar el riesgo de que la inteligencia artificial acabe provocando una reducción neta del empleo. Además, deberían recordar que lo que para una empresa son costes y empleados constituye una fuente de ingresos para otra.
Por lo tanto, aunque los inversores no deberían pasar por alto los riesgos al alza para la inflación a corto plazo derivados del encarecimiento de los alimentos, la energía y los semiconductores, que podrían traducirse en una aceleración del crecimiento de los salarios y de los costes laborales unitarios, consideramos poco probable que estemos volviendo a un entorno de inflación elevada de manera persistente como el que vivimos en la década de 1970.
La importancia de la respuesta política
Las perspectivas de inflación a medio y largo plazo también dependerán de cómo respondan conjuntamente las políticas monetaria y fiscal tanto a las presiones inflacionistas a corto plazo como al posible efecto desinflacionista de la inteligencia artificial a medio plazo.
Las autoridades siempre pueden atajar la inflación subiendo los tipos de interés o los impuestos, al igual que pueden generarla si crean y distribuyen una cantidad suficiente de dinero. A medio y largo plazo, también habrá que valorar cuidadosamente hasta qué punto serían eficaces las bajadas de tipos si la inteligencia artificial empezara a provocar una pérdida neta de empleo, y habrá que tener en cuenta la posibilidad de que, más adelante, se recurra a medidas de estímulo fiscal financiadas mediante procesos de expansión cuantitativa, así como considerar la magnitud que dichas medidas podrían alcanzar.
No obstante, somos conscientes de que, pese a que Kevin Warsh, nuevo presidente de la Reserva Federal, se ha mostrado abierto en el pasado a la posibilidad de recortar los tipos de interés si la inteligencia artificial acaba favoreciendo un aumento de la productividad, lo cierto es que mantiene una firme oposición ideológica a la expansión del balance del banco central, salvo cuando resulte necesaria para proporcionar liquidez de emergencia. Poco después de la crisis financiera, expresó abiertamente su rechazo y dimitió de la Reserva Federal por su desacuerdo con nuevas rondas de expansión cuantitativa, ante el temor de que acabaran provocando inflación. No hay que olvidar que, en aquel momento, el desempleo seguía siendo muy elevado y el crecimiento del crédito muy débil.
El elevado nivel de deuda pública en relación con el PIB y el aumento de los déficits fiscales primarios en muchos países, junto con el impacto de la inteligencia artificial sobre los ingresos públicos, los costes de financiación y otras partidas de gasto, podrían acabar influyendo también en la orientación de las políticas monetaria y fiscal y, por tanto, en las perspectivas de inflación a largo plazo. Por ello, son factores que conviene tener en cuenta y seguir de cerca.
Aprendamos del pasado sin dar por hecho que se repetirá
La principal conclusión de todo esto es que, pese a que la inflación podría aumentar a corto plazo, el regreso a un entorno en el que las crisis de oferta se vuelven más frecuentes no significa que estemos destinados a repetir el régimen inflacionista que vivimos en la década de 1970. Al fin y al cabo, la inteligencia artificial tiene el potencial de generar un enorme impulso positivo por el lado de la oferta, que podría llevar también a una fuerte reducción de la demanda de trabajadores.
En definitiva, aunque la inflación y los tipos de interés podrían subir a muy corto plazo, tal y como descuentan los mercados, a medio plazo también podrían descender de forma bastante acusada. Más adelante, la interacción entre la inteligencia artificial, la robótica, el contexto demográfico y la deuda, así como la respuesta política, fiscal y monetaria que de ella se derive, podrían determinar las perspectivas de inflación a largo plazo. Los inversores deben prestar especial atención a la evolución de los distintos riesgos para la inflación y los tipos de interés, sin perder de vista ni los riesgos al alza a corto plazo, ni los riesgos a la baja a medio plazo, ni la diversidad de posibles escenarios a largo plazo. Para ello, será necesario actuar con agilidad y contar con un marco claro para evaluar las perspectivas de inflación.
Aunque el análisis del pasado resulta crucial para determinar las similitudes y las diferencias con la situación actual y sus posibles consecuencias, existe la posibilidad real de que el futuro se aleje considerablemente de los patrones observados hasta ahora.
Consecuencias para la inversión
- En nuestra opinión, las expectativas que descuentan actualmente los mercados para la inflación en Estados Unidos parecen algo bajas, teniendo en cuenta los riesgos al alza a corto plazo.
- Sin embargo, los inversores no deberían dar por hecho que la combinación de crisis de oferta y aumento de los rendimientos de los bonos significa que estamos volviendo a los niveles de inflación o de tipos de interés que vivimos en la década de 1970.
- Dado que, a medio y largo plazo, los riesgos para la inflación pueden materializarse tanto al alza como a la baja, especialmente por el impacto de la inteligencia artificial, los inversores en renta fija deberán prestar especial atención a cómo pueden evolucionar esos riesgos en los distintos horizontes temporales y reaccionar con rapidez a dicha evolución.
- La posibilidad de disponer de una gama amplia de herramientas de inversión, con capacidad para adaptarse a los cambios que puedan producirse en la pendiente y la forma de las curvas de tipos, así como a escenarios de inflación tanto al alza como a la baja, podría resultar especialmente útil para los inversores en renta fija en los próximos años.