Key takeaways:
- Near-term inflation risks are skewed to the upside: supply-side shocks (energy and food) along with strong demand for semiconductors are pushing headline inflation higher. However, moderate unit labour cost, personal income, money and credit growth suggest we’re currently a long way from a 1970s-style inflation regime.
- Medium-term, AI could be disinflationary: if AI delivers productivity gains, it could act as a major positive supply shock, keeping unit labour costs and inflation low. If those productivity gains come with net job losses, AI could even prove deflationary.
- The policy response matters, particularly in the long-term. Investors should focus on the sequencing of inflation risks: inflation and interest rates could rise in the very near-term, fall sharply in the medium term, and will be determined in the long-term by the interaction of AI, demographics, debt and the fiscal and monetary policy response. Don’t be blind to near-term upside risks, medium-term downside risks, or the range of long-term possibilities. Being nimble will be necessary.
Several people have asked me recently whether we are heading back to the 1970s when it comes to inflation. With energy prices rising again due to the war with Iran, food supply under pressure from a scorching summer and potentially record-strength El Niño, and AI capex booming, investors are understandably currently focused on the upside risks to inflation.
While there are similarities between now and the 70s, there are also some very important differences. In particular, the potential productivity gains that AI could offer need to be considered. So, while inflation and rates may rise in the near term, it doesn’t look likely that inflation is heading back to the 70s. I’ll focus on the US in this piece but consider what the equivalent data/ charts look like in other countries when thinking about the outlook for inflation elsewhere.
From positive to negative supply shocks
For most of the period since the early 1980s, globalisation and particularly the entry of China’s enormous population to the global capitalist workforce acted as a massive positive supply shock helping to anchor inflation. The shale energy revolution also represented another substantial positive supply shock.
However, as in the 70s, the 2020s have so far seen repeated negative supply shocks. First Covid, then Russia’s invasion of Ukraine, and now the war with Iran. Clearly, climate-related disruptions to food supply are also becoming more of a risk too, as the world heats up. Of course, the climate-related shocks to food supply come on top of the disruption to energy and fertiliser supply resulting from the conflict in the Middle East.
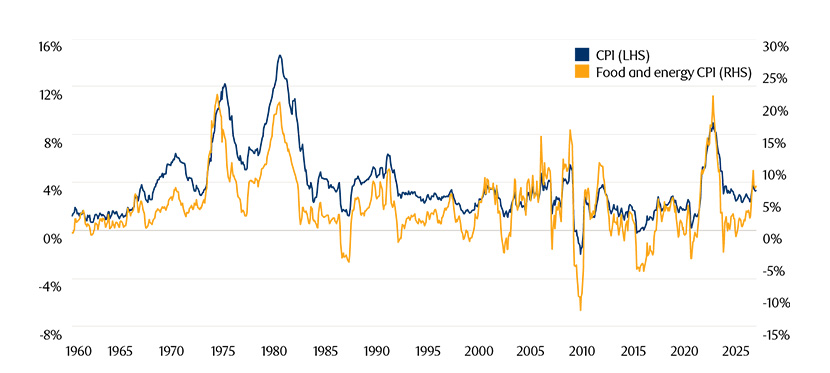
Energy prices have clearly already risen sharply, while food prices are also likely to rise. Increases in food and energy prices nearly always lead to higher headline inflation, as we have already seen since the start of the war with Iran, with energy prices driving inflation higher. And food prices could soon also put upward pressure on headline inflation.
Figure 1: Higher energy and food prices typically lead to higher headline inflation
Source: BLS, Macrobond, latest available data as at 22.9.26
For higher food and energy prices not to lead to higher headline inflation, core inflation would have to slow materially as food and energy prices rose. That is uncommon because consumers can generally spend out of savings or borrow to fund higher food and energy prices, at least initially. Therefore, core inflation isn’t instantly forced down as food and energy prices climb, causing headline inflation to rise in the near term.
A wage-price spiral?
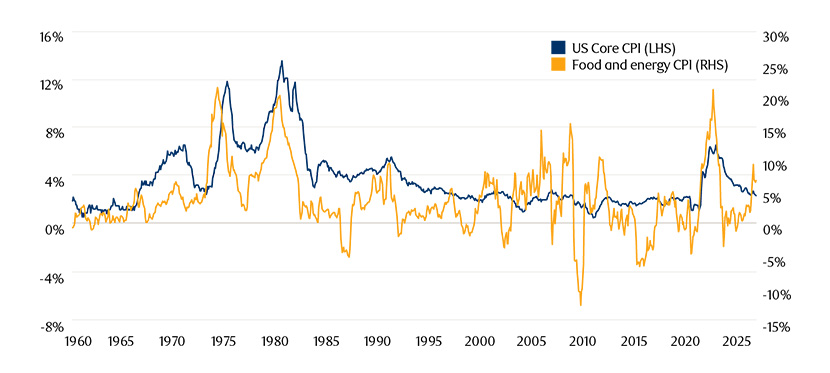
Of more interest to central banks though is whether negative supply side shocks will lead to persistently higher core inflation. Higher food and energy prices can transmit directly into higher core inflation, for example via food price increases leading to higher prices in restaurants, as we have all experienced in recent years. But the risk that central banks really want to guard against is of a wage-price or price-wage (depending on which comes first) spiral that can lead to persistent core inflation. It’s notable though that negative supply shocks don’t always lead to a material, let alone persistent, increase in core inflation.
Figure 2: Higher food and energy prices don’t always lead to higher core inflation
Source: BLS, Macrobond, latest available data as at 22.9.26
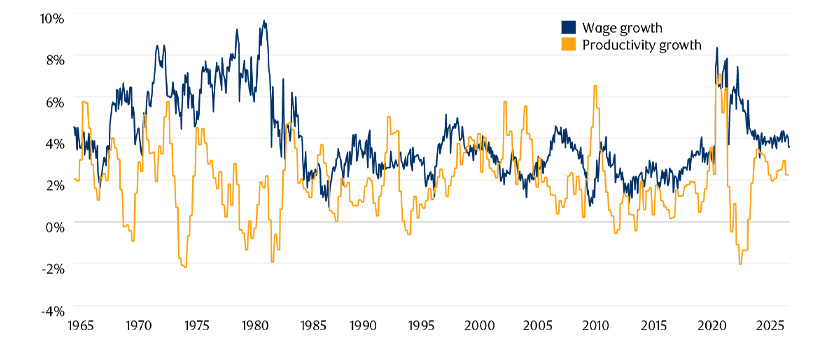
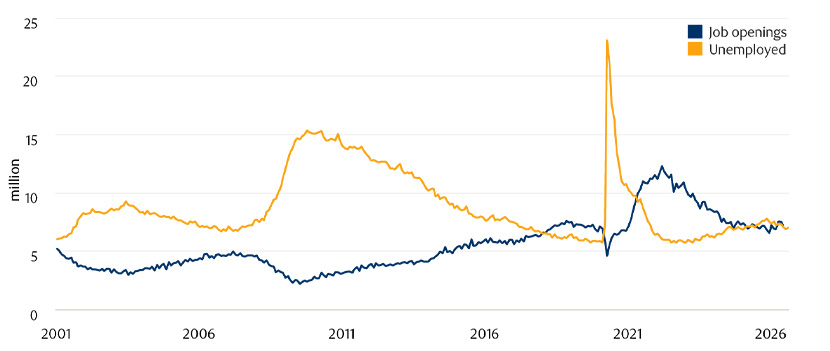
Clearly, wage growth matters for the persistence of core inflation. In the 1970s, wage growth was high and stayed high, even during the recessions, partly due to high unionisation and cost of living adjustments (COLAs). Wage growth also accelerated in 2022 due to a very tight labour market, with a boom in job vacancies, as demand roared back post Covid.
Figure 3: Wage growth needn’t lead to core inflation if offset by productivity growth
Source: BLS, Macrobond, data latest available as at 22.9.26
But wage growth doesn’t have to lead to core inflation if it is offset by productivity growth. If businesses sell more goods or services, they can afford to raise wages without raising prices. Likewise, if there’s more available to buy, wage gains don’t have to push up prices. US wage growth is not currently particularly high relative to productivity growth.
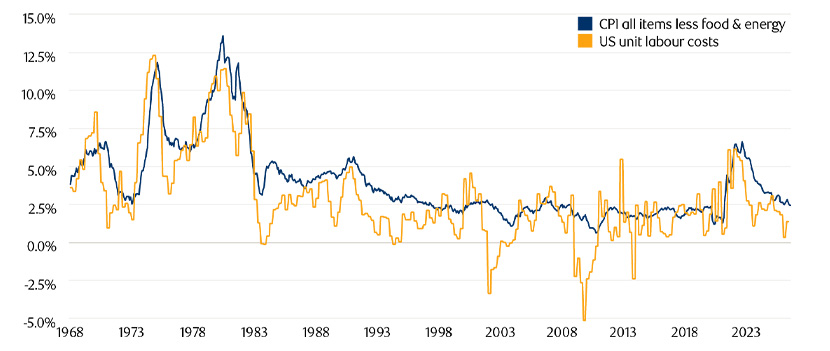
Adjusting wage growth for productivity growth gives what is called unit labour cost growth. While unit labour cost growth could rise somewhat, in response to the recent negative supply shocks and higher headline inflation, it doesn’t currently point to a meaningful long-term inflation problem. The contrast with the 1970s and 2022 is stark.
Figure 4: Unit labour cost growth is much lower than in the 70s
Source: BLS, Macrobond data latest available as at 22.9.26
While monitoring wage and unit labour cost growth it’s worth noting that if real wage growth contracts sharply then it can contribute to a recession, often along with tighter monetary policy, which can ultimately prove disinflationary in the medium-term.
Weak credit growth argues against persistently high inflation
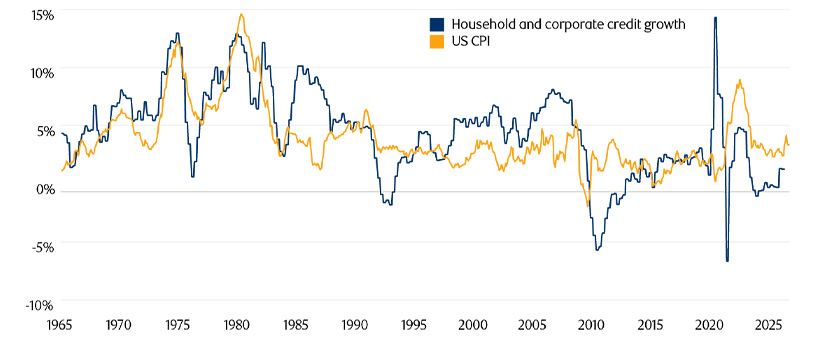
A lot of spending, and hence income growth, is financed from credit growth. Hence the difference between credit growth and real output growth is closely linked to inflation. Some household credit growth ends up inflating house prices, which is not fully captured in inflation measures, as in the mid-80s, late 90s and in the 2000s prior to the global financial crisis (GFC).
Figure 5: US private sector credit growth today is muted
Source: BIS, BLS, Macrobond data latest available as at 22.9.26
Weak credit growth helps explain why QE after the financial crisis didn’t lead to meaningful inflation. If credit contracts, some new money needs to be created just to offset the contraction in credit. It’s the balance that matters.
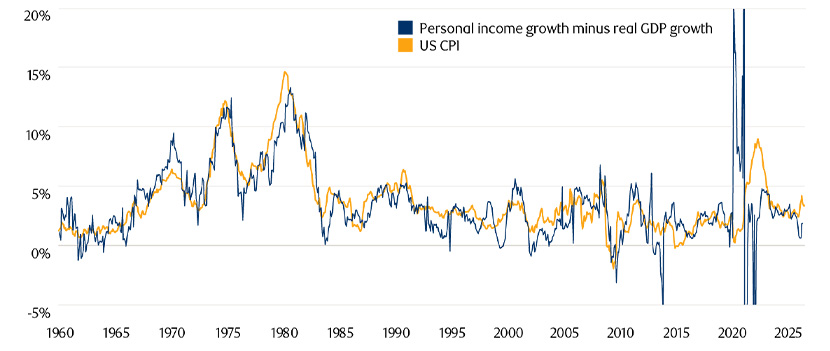
Unlike after the GFC, during Covid, QE directly funded massive government stimulus that went straight to consumers and substantially boosted their incomes (including fiscal transfers) and so contributed to significant inflation once those income gains were spent. Some stimulus was clearly required but the amount provided was excessive.
Figure 6: Personal income growth (including government transfers) matters for inflation
Source: BEA, BLS, Macrobond, latest available data as at 22.9.26
Today, overall US private sector credit growth is relatively muted, even though the big tech companies investing in AI are borrowing to fund some of their data centre capex, putting upward pressure on semiconductor prices and some of the electronic goods they go into.
In the near term then, negative supply side shocks are again putting upward pressure on energy prices and could soon do the same for food prices, while booming tech capex is putting upward pressure on chip prices. However, in the medium-term, relatively low unit labour cost growth, personal income growth relative to real output growth and moderate overall credit growth suggest that we’re a long way from returning to the kind of inflation regime we saw in the 1970s.
The lack of QE funded government stimulus and much less room for a reduction in the household savings rate meaningfully reduce the risk of a repeat of the type of inflation seen in 2021/2022 too. While we think meaningful fiscal stimulus is unlikely prior to or post the mid-terms that needs monitoring given recent comments from the US administration.
A less tight labour market also reduces the risk of as sharp a rise in unit labour costs as was seen in 2022. It will still be important to monitor unit labour cost growth carefully though given the labour market remains relatively tight, despite having loosened materially since 2022.
Figure 7: The labour market is looser than in 2022 but still quite tight
Source: BLS, Macrobond data latest available as at 22.9.26
Demographics/Immigration vs AI
When considering the difference between today and the 1970s and 2022 it’s also important to consider labour force growth and AI.
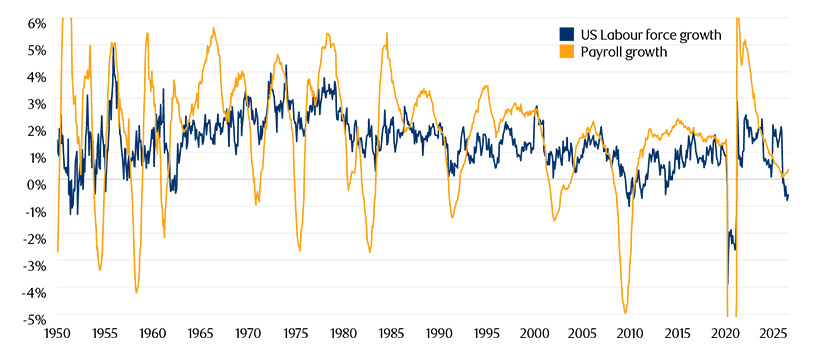
Labour force growth (the number of available workers) has recently turned negative, mainly due to ageing and immigration measures. With the economy close to most estimates of full employment it is hard for real output to grow faster than productivity growth. All else equal, this could be inflationary, while also making real growth more vulnerable to negative supply side shocks.
Figure 8: The labour force is not growing like it did in the 70s
Source: BLS, Macrobond, latest available data as at 22.9.26
But all else is rarely equal. Rember that during the 2022 inflation shock, employment was rising rapidly and few were worried about AI taking their jobs.
AI could lead to significant productivity growth. If it doesn’t then capex would likely eventually be cut back to an extent that could induce a recession like the one seen in the early 2000s, when the dot-com capex and stock market bubbles burst.
Let’s assume though that AI does deliver productivity gains, which seems like the most likely outcome. In the most positive possible scenario, this productivity growth could come without net job losses and allow an increase in real output and real wages, while keeping unit labour costs and inflation low.
However, it is also possible that productivity gains allow companies to reduce the number of staff they need. If the reduction in employment was to exceed the reduction in the labour force, then the rise in unemployment could quite quickly become disinflationary and even potentially deflationary.
Historically, companies have tended to only cut jobs when profits come under pressure. But we are already seeing some instances of companies cutting jobs, while investing in AI, with profits (albeit not always free cash flow) still growing.
Investors should therefore not be complacent about the potential that AI could lead to net job cuts. Investors should also remember that one company’s costs/employees are the source of other companies’ revenues and incomes.
Overall, therefore, while investors should not ignore the near-term upside risks to inflation from higher food, energy and semiconductor prices potentially leading to an acceleration in wage and unit labour cost growth, we think it is unlikely that we are heading back to the persistently high inflation of the 1970s.
The policy response matters
Of course, the combined monetary and fiscal policy response both to near term upside pressure on inflation but also to AI’s potential medium term disinflationary effects will also be important to consider and monitor when thinking about the medium and long-term inflation outlook.
The authorities can always crush inflation by raising rates or taxes enough, likewise they can always create inflation by printing and distributing enough money. In the medium to long term one must also carefully consider the effectiveness of rate cuts if AI were to start to lead to net job losses. The potential for eventual QE funded fiscal stimulus, and its magnitude, must also be considered.
We are conscious though that while new Fed Chair Warsh has shown openness in the past to the idea of cutting rates because of AI driven productivity gains, he has a fierce ideological opposition to Fed balance sheet expansion other than for emergency liquidity purposes. Soon after the financial crisis, he protested loudly and resigned from the Fed over their pursuit of further bouts of QE, for fear that it would cause inflation. Remember that at the time unemployment was still very high and credit growth was very weak.
The elevated level of government debt relative to GDP and rising primary fiscal deficits in many countries, along with AI’s effect on government revenues, borrowing costs and other expenditures will also likely eventually influence monetary and fiscal policy and hence the long-term inflation outlook and so are also important to consider and monitor.
Not stuck in the past
The key takeaway should be that while inflation could rise in the near term, a return to a world of more frequent negative supply shocks doesn’t mean we’re destined to return to the inflation regime of the 1970s. After all, AI has the potential to be a huge positive supply shock that could also lead to a substantial decline in demand for workers.
In short, while inflation and interest rates could rise in the very near term (as markets expect), in the medium term both inflation and rates could potentially fall quite sharply. Beyond that the interaction of AI, robotics, demographics and debt and the resulting political, fiscal and monetary policy response will likely determine the long-term inflation outlook. Investors though need to think carefully about the sequencing of the inflation and interest rate risks and not be blind to the near-term upside risks, the medium-term downside risks or the multiple possible long-term outcomes. For investors, it will be necessary to be nimble and have a clear framework for assessing the inflation outlook.
While studying the past is crucial to ascertain the similarities and differences between then and now and the potential implications, there is a real possibility today that the future could look quite different to what we’ve seen before.
Investment implications
- Market pricing for the US inflation outlook currently seems a bit low, in our view, given the near-term upside risks to inflation.
- However, investors shouldn’t assume that a combination of negative supply shocks and rising bond yields means we’re heading back to the levels of inflation or interest rates seen in the 70s.
- Given two-way risks to inflation over the medium to long term, particularly because of AI, bond investors will need to consider the sequencing of inflation risks and remain nimble.
- A broad investing tool-kit, with the ability to position for changes in the shape of yield curves, as well as being able to position for both rising and falling inflation, could help bond investors over the coming years.