Despite being the world’s largest pool of credit, at $29 trillion1 in size, emerging market debt (EMD) remains one of the most misunderstood markets amongst investors. We provide an overview of EMD and help investors consider the practical aspects of investing in this asset class.
What constitutes emerging market debt? (quick links):
Emerging market debt refers to the outstanding tradeable debt issued by emerging market governments or corporations domiciled in those countries. Of the roughly 200 countries in the world today, 41 are considered ‘developed’ economies by the International Monetary Fund (IMF) with the remaining classified as ‘emerging market and developing’.
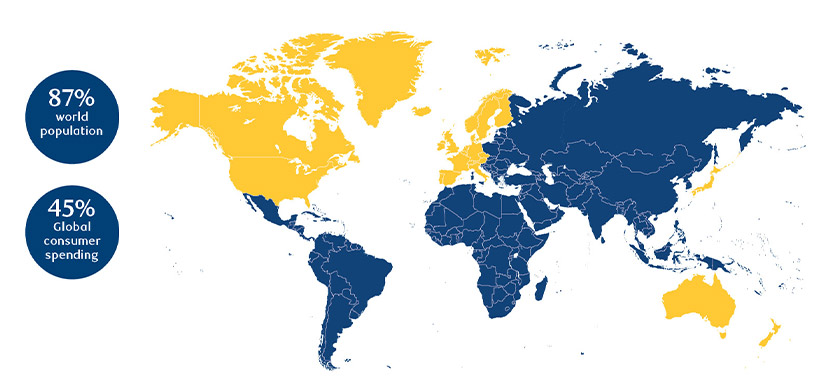
Combined, emerging market economies account for over 50% of global Gross Domestic Product (GDP), 45% of global consumer spending and roughly 87% of the world’s population2. The EM debt universe comprises four primary sub-classes: hard currency (denominated in a globally traded currency of a developed country, such as the US dollar or euro) and local currency and containing both sovereign and corporate debt.
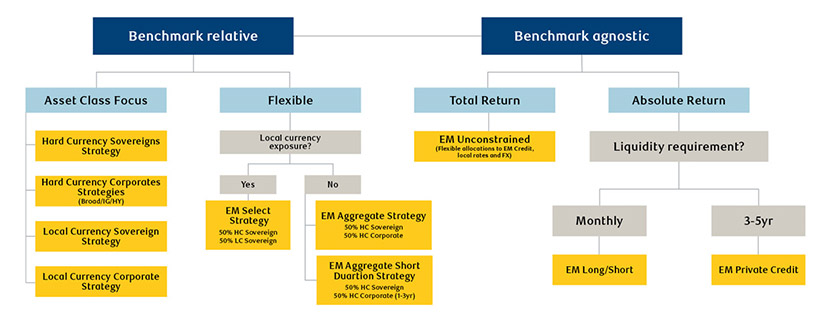
Figure 1: Finding the best solution for EMD exposures
Source: RBC GAM, as at December 2024.
What constitutes emerging market debt?
Despite being the world’s largest pool of credit, at $29 trillion in size, EMD or emerging market debt remains one of the most misunderstood markets amongst investors, not only in terms of composition of the asset class but also the risk-reward profile of the underlying assets. Indeed, asset allocators and investors alike are often surprised to discover the breadth, versatility and return opportunities the asset class can offer their portfolios and, moreover, the fundamental and liquidity characteristics of various sub-asset classes.
In the note below, we provide an overview of EMD, summarizing the distinct sub-asset classes that offer differentiated risk-return characteristics that can potentially enhance portfolio outcomes.
Defining emerging market debt
Emerging market debt refers to the outstanding tradeable debt issued by emerging market governments or corporations domiciled in those countries. Although there is no official definition, within capital markets the term ‘emerging markets’ is generally used to refer to countries with lower per capita income and limited integration within the global financial system.
While they have may have an established financial infrastructure, the institutional strengths and market characteristics of these emerging markets may not be on par with the efficiency, accounting standards or securities regulations of ‘developed’ nations.
Of the roughly 200 countries in the world today, 41 are considered ‘developed’ economies by the IMF with the remaining classified as ‘emerging market and developing’. These countries are widely dispersed across Latin America, Asia, Eastern Europe, the Middle East and Africa, and range in size from giants like China and India to much smaller countries such as Belize and Ivory Coast. Combined, emerging market economies account for over 50% of global GDP, 45% of global consumer spending and roughly 87% of the world’s population.
Figure 2: Emerging market debt spans a wide range of countries
Source: Oxford Economics and the IMF, as at 30 September 2024
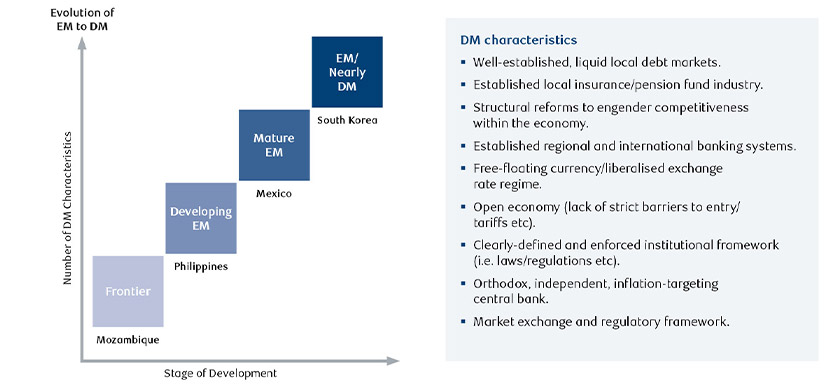
Market liquidity and governance factors have historically been a key factor in defining classification. Some countries such as South Korea are considered developed by the IMF but deemed as emerging by some market participants. Likewise, some EM countries, such as Brazil, China, and India rank amongst the world’s largest economies, but are considered by most as emerging economies. At the opposite end of the spectrum there are frontier markets (less developed economies) such as Mozambique, which are typically smaller and have less liquid capital markets.
Clearly these markets will not have progressed as far down the path as today’s developed markets (DM), and as such, debt from these economies will be subject to a higher level of risk premia than their developed counterparts, thus rewarding investors with a higher yield. Figure 3 shows the stages of development as emerging countries transition towards developed market status.
Figure 3: Emerging markets - not all countries are at the same stage of development
Source: BlueBay Asset Management
The investable universe
The size and sophistication of the investable universe of debt issued in emerging countries has increased substantially over the last 30 years. EM debt was once issued only sporadically and in US dollar denominations, but today far fewer EM governments require support from G-7 nations for their funding and are able to access the international capital markets directly. Moreover, because of strong internal growth, economic development and favourable macroeconomic factors, many EM sovereigns have also developed deeper domestic capital markets. This has, in many cases, translated into a significant shift to local currency debt issuance.
The EM debt universe comprises four primary sub-classes and accounts for nearly US$29 trillion3. This is a large heterogenous asset class with debt issued in both hard currency (denominated in a globally traded currency of a developed country, such as the US dollar or euro) and local currency and containing both sovereign and corporate debt.
The following compares the key characteristics of the four main sub-asset classes:
Hard currency sovereign debt
- Longest serving sub asset class in EMD.
- Significant diversification with 80+ countries.
- Total debt stock at ≈US$1.5 trillion4.
- Reasonably liquid bond universe.
- Most commonly used benchmark: JP Morgan Emerging Market Bond Index Global Diversified.
- No direct currency risk.
- Possible default or restructuring risk.
- Duration risk – index duration ≈ 7 years.
- Index includes quasi sovereign issuers5.
- Increasing issuance of sustainability linked bonds.
The EM hard currency sovereign sub-class is the oldest and most established going back to the Brady bond era in the early 1990s. The market has since evolved significantly, presenting a broad opportunity set for investors. Not surprisingly, it has the largest group of managers involved and is more familiar to many investors.
These bonds have a global investor base and tend to trade at a spread over US Treasuries and are therefore much more sensitive to US rates. Compared to local currency bonds, hard currency bonds also tend to have longer maturities and larger issuance sizes, making them easier to trade on the secondary market. The depth of the market and diverse set of participants, including local and foreign investors, translates into higher trade volumes and strong liquidity levels.
Hard currency corporate debt
- At ≈ US$2.5 trillion6, this is one of the fastest growing asset classes, with a disproportionately low dedicated AuM.
- The resulting inefficiencies provide scope for alpha generation across sectors, regions, and portfolio strategies.
- Most commonly used benchmark: JP Morgan Corporate Emerging Market Bond Index (CEMBI) Diversified.
- Highly diverse universe, with ≈500 issuers from 44 countries.
- No direct currency risk.
- Corporate default risk.
- Opportunity to participate in improving Environmental, Social & Governance (ESG) trends, such as Indian renewables sector.
The hard currency EM corporate debt market is a diverse and very well-established asset class which has seen strong growth in the last decade, driven by robust investor demand, rapid long-term EM economic growth, and increasing integration into global capital markets. Despite being a majority investment grade (IG) rated asset class, EM corporate debt has offered higher yield over similarly rated DM corporates, a reflection of the higher risk premium investors typically require when investing in EM. However, investor perception of risk in emerging markets is changing as corporate governance and transparency continue to improve and macro policy across the EM universe has become more orthodox.
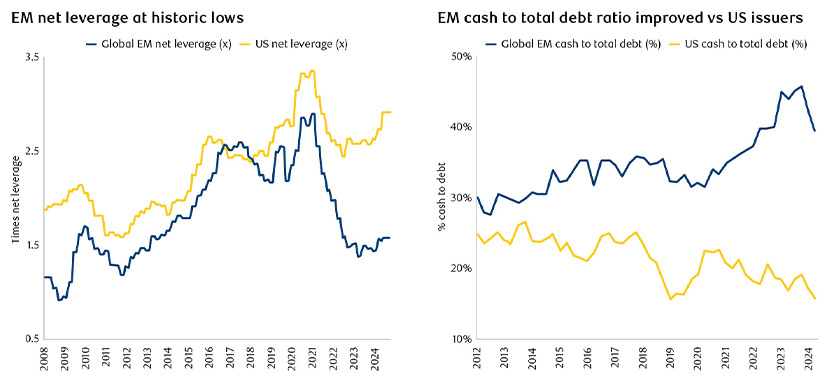
At a company level, fundamentals have seen considerable improvement over the last few years as EM corporates have consistently reported lower leverage and higher cash to total debt ratios than their US counterparts. Currently, the difference in net leverage and cash to debt ratio in EM vs DM (using US corporates as a proxy) stands above 10-year highs (Figure 4).
Figure 4: EM net leverage near historic lows relative to US peers
Source: Bank of America, Merrill Lynch, as at 31 December 2024.
Local currency sovereign debt
- Largest EMD sub-sector at ≈ US$12 trillion7.
- Currency and rates risk.
- Most commonly used benchmark: JP Morgan GBI-EM Global Diversified Index Unhedged.
- Concentrated index – 20 countries represented.
- Growing asset class.
- Considerably lower default risk.
- Ample liquidity.
The EM local currency market is a vast, rapidly growing universe. The range includes countries that are more mature, with a full scope of liquid cash and derivative instruments, to markets that are considered ‘frontier’, embarking on a long and difficult process of opening their capital accounts and deepening their local markets to attract foreign capital.
Opportunities for diversification are vast, with a multitude of sovereign and corporate issuers, inflation-linked and nominal debt, free floating to managed or pegged currencies. Debt denominated in local EM currencies typically have shorter duration and are more influenced by local inflation expectations and central bank policies. Investors in EM local currency debt tend to be domestic market participants and specialized EM funds.
Despite the breadth of the opportunity set, the most widely used index – the JPM GBI-EM Global Diversified Index Unhedged – reflects only a very specific subset of the universe, limited to the larger, more liquid markets. The price for limiting the benchmark to this subset, however, is that it has become a very concentrated and highly volatile point of reference for the market. Indeed, this detracts from the very specific diversification benefits which draw investors to this asset class in the first place.
Local currency corporate debt
- Large sub asset class at ≈ US$10.7 trillion8.
- Asset class is relatively new and fast growing.
- Most commonly used benchmark: BofA Diversified Local Emerging Markets Non-Sovereign Index.
- Very attractive yield with low duration risk.
- Currency risk.
- Corporate default risk.
- Lack of dedicated funds mean technical support is limited.
The EM local currency corporate debt market, in its broadest form, covers over 80% of the global EM debt universe, with local capital markets in varying stages of development. This ranges from more mature EM countries, such as Brazil and Mexico, to markets that are considered frontier, such as Kazakhstan, and which can offer idiosyncratic opportunities. Local currency corporates typically offer higher yields when compared to local currency sovereigns due to the additional credit risk, and they are often less liquid with fragmented issuance across different countries and regulatory frameworks.
In addition, while governments actively seek foreign investment for local currency sovereign bonds, corporate debt tends to have greater restriction on foreign investor participation. These challenges combined have limited the level of foreign investor sponsorship of the local currency EM corporate sub-asset class, despite the overall higher credit ratings and lower duration risk.
1 JPMorgan, RBC BlueBay Asset Management, as at December 2024.
2 IMF, as at Q3 2024.
3 JPMorgan, as at 31 December 2024.
4 RBC Global Asset Management, as at 31 December 2024.
5 Quasi-sovereign: an entity that is 100% guaranteed by a sovereign or majority owned or controlled by a sovereign.
6 RBC Global Asset Management, as at 31 December 2024.
7, 8 RBC Global Asset Management, as at 31 December 2024.
Helping you better understand emerging market debt