Ce qu’il faut retenir:
- Les risques d’inflation à court terme sont orientés à la hausse : les chocs du côté de l’offre (énergie et alimentation), associés à une forte demande de semi-conducteurs, font grimper l’inflation globale. Toutefois, la croissance modérée des coûts salariaux unitaires, des revenus des particuliers, de la masse monétaire et du crédit suggère que nous sommes actuellement très loin d’un régime d’inflation similaire à celui des années 1970.
- À moyen terme, l’IA pourrait avoir un effet désinflationniste : si elle génère des gains de productivité, elle pourrait entraîner un choc d’offre positif majeur, maintenant les coûts salariaux unitaires et l’inflation à un faible niveau. Si ces gains de productivité s’accompagnent de pertes nettes d’emplois, l’IA pourrait même s’avérer déflationniste.
- La réponse politique est déterminante, en particulier à long terme. Les investisseurs devraient se concentrer sur l’évolution des risques d’inflation : l’inflation et les taux d’intérêt pourraient augmenter à très court terme, baisser fortement à moyen terme, et seront déterminés à long terme par l’interaction entre l’intelligence artificielle, la démographie, la dette et les mesures prises en matière de politique budgétaire et monétaire. Il ne faut pas ignorer les risques haussiers à court terme, les risques baissiers à moyen terme, ni l’éventail des possibilités à long terme. Il sera nécessaire de faire preuve de souplesse.
Plusieurs personnes m’ont récemment demandé si nous étions en train de revenir à la situation des années 1970 en matière d’inflation. Avec la nouvelle hausse des prix de l’énergie due à la guerre avec l’Iran, l’approvisionnement alimentaire mis à rude épreuve par un été caniculaire et un phénomène El Niño d’une intensité record, ainsi que l’explosion des dépenses d’investissement dans l’IA, les investisseurs se concentrent actuellement, à juste titre, sur les risques de hausse de l’inflation.
S’il existe des similitudes entre la situation actuelle et celle des années 70, il y a également des différences très importantes. Ainsi, il est important de prendre en compte les gains de productivité potentiels que pourrait offrir l’IA. Ainsi, même s’il est possible que l’inflation et les taux d’intérêt augmentent à court terme, il semble peu probable que l’inflation revienne aux niveaux des années 70. Cette analyse se concentre sur les États-Unis, mais l’examen des données et graphiques correspondants dans les autres pays permet également d’éclairer leurs perspectives d’inflation.
Des chocs d’offre positifs aux chocs d’offre négatifs
Pendant la majeure partie de la période écoulée depuis le début des années 1980, la mondialisation, et notamment l’intégration de l’immense population active chinoise à la main-d’œuvre mondiale, a constitué un puissant choc d’offre positif, contribuant à contenir l’inflation. La révolution de l’énergie de schiste a également représenté un autre choc d’offre positif substantiel.
Cependant, comme dans les années 70, les années 2020 ont jusqu’à présent été marquées par des chocs d’offre négatifs répétés. D'abord l’épidémie de Covid, puis l'invasion de l'Ukraine par la Russie, et aujourd'hui la guerre avec l'Iran. À mesure que la planète se réchauffe, les perturbations de l'approvisionnement alimentaire liées au climat vont également représenter un risque de plus en plus important. Les chocs climatiques qui affectent l’offre alimentaire s’ajoutent, bien entendu, aux perturbations de l’approvisionnement en énergie et en engrais provoquées par le conflit au Moyen-Orient.
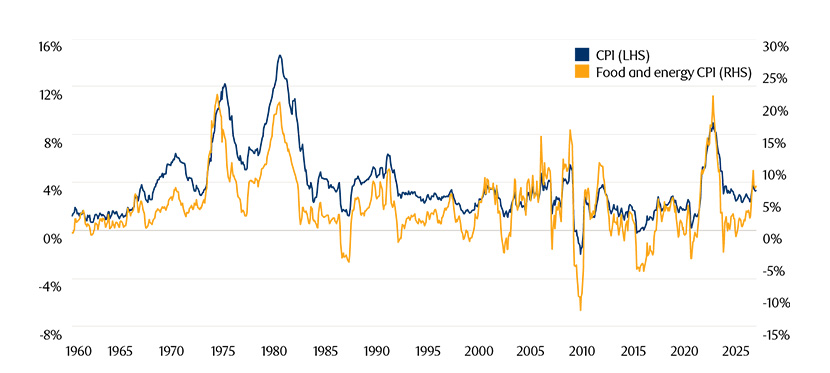
Les prix de l’énergie ont déjà enregistré une forte hausse, tandis que les prix alimentaires devraient également augmenter. Les hausses des prix de l’énergie et des produits alimentaires se répercutent presque toujours sur l’inflation globale. C’est déjà ce que l’on a pu observer depuis le début du conflit avec l’Iran, la hausse des prix de l’énergie ayant contribué à accélérer l’inflation. Les prix alimentaires pourraient bientôt, eux aussi, exercer des pressions à la hausse sur l’inflation globale.
Figure 1 : La hausse des prix de l'énergie et des denrées alimentaires entraîne généralement une augmentation de l'inflation globale
Source : BLS, Macrobond, dernières données disponibles au 22 septembre 2026.
Légendes : CPI (échelle gauche) CPI alimentation et énergie (échelle droite)
Pour que la hausse des prix alimentaires et énergétiques ne se traduise pas par une accélération de l’inflation globale, il faudrait que l’inflation sous-jacente ralentisse sensiblement à mesure que les prix de l’alimentation et de l’énergie augmentent. Ce cas de figure est rare, sachant que les consommateurs peuvent généralement puiser dans leur épargne ou recourir à l'emprunt pour faire face à la hausse des prix des denrées alimentaires et de l'énergie, du moins dans un premier temps. Ainsi, la hausse des prix alimentaires et énergétiques n’entraîne pas mécaniquement un ralentissement immédiat de l’inflation sous-jacente, tandis qu’elle pousse l’inflation globale à la hausse à court terme.
Une spirale salaires-prix ?
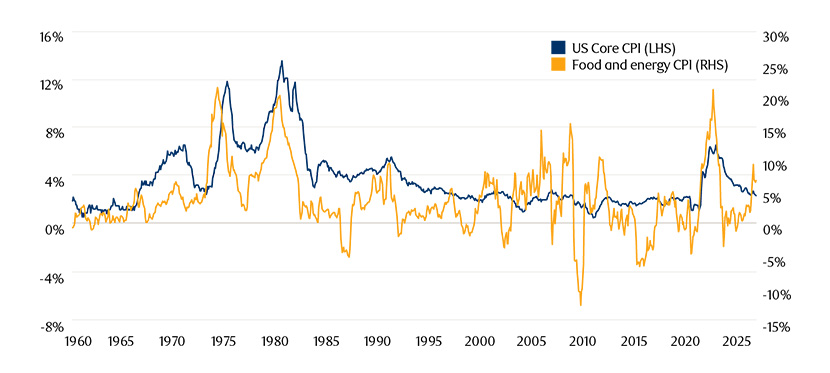
Ce qui intéresse davantage les banques centrales, c’est de savoir si des chocs négatifs côté offre entraîneront une hausse persistante de l’inflation sous-jacente. En effet, la hausse des prix des denrées alimentaires et de l’énergie peut se répercuter directement sur l’inflation sous-jacente, par exemple lorsque l’augmentation des prix alimentaires entraîne celle des prix dans les restaurants, comme nous l’avons tous constaté ces dernières années. Cependant, le risque contre lequel les banques centrales souhaitent véritablement se prémunir est celui d’une spirale salaires-prix ou prix-salaires (selon celle qui survient en premier) susceptible d’entraîner une inflation sous-jacente persistante. Il convient toutefois de noter que les chocs négatifs côté offre n’entraînent pas toujours une hausse significative, et encore moins persistante, de l’inflation sous-jacente.
Figure 2 : Les prix alimentaires et de l’énergie n’entraînent pas toujours une hausse de l’inflation sous-jacent
Source : BLS, Macrobond, dernières données disponibles au 22 septembre 2026.
Légendes : CPI sous-jacent US (échelle gauche)/CPI alimentation et énergie (échelle droite)
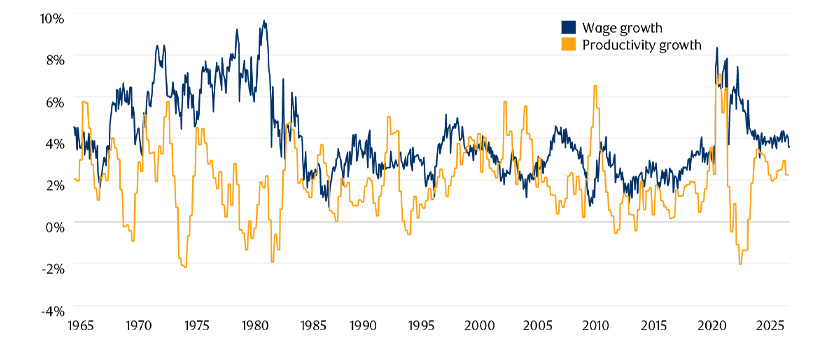
Il est clair que la progression des salaires joue un rôle déterminant dans la persistance de l’inflation sous-jacente. Dans les années 1970, la croissance des salaires était élevée et durable, même pendant les récessions, notamment en raison du fort taux de syndicalisation et des mécanismes d’indexation des salaires au coût de la vie (Cost of Living Adjustment ou COLA). La croissance des salaires s'est également accélérée en 2022 en raison d'un marché du travail très tendu, marqué par une explosion du nombre d'offres d'emploi, alors que la demande reprenait de plus belle après la pandémie de Covid.
Figure 3 : La hausse des salaires n'entraîne pas nécessairement une inflation sous-jacente si elle est compensée par une croissance de la productivité
Source : BLS, Macrobond, dernières données disponibles au 22 septembre 2026
Légendes : Croissance des salaires /Croissance de la productivité
La hausse des salaires n’entraîne pas nécessairement une inflation sous-jacente si elle est compensée par une croissance de la productivité. Si les entreprises vendent davantage de biens ou de services, elles peuvent se permettre d’augmenter les salaires sans augmenter les prix. De même, s’il y a davantage de produits disponibles à l’achat, les hausses salariales ne font pas nécessairement faire grimper les prix. La croissance des salaires aux États-Unis n’est actuellement pas particulièrement élevée par rapport à la croissance de la productivité.
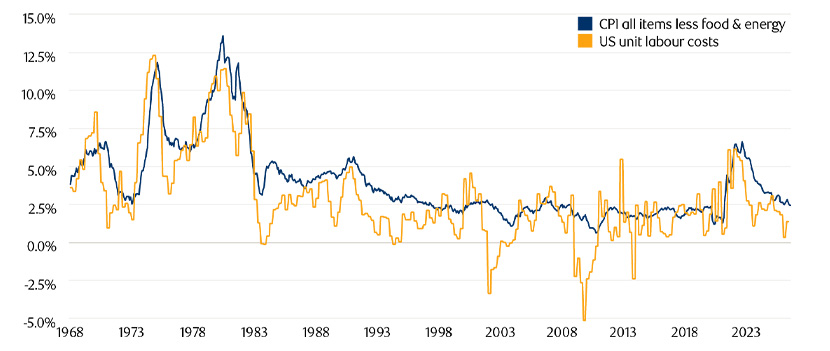
En ajustant la croissance des salaires en fonction de la croissance de la productivité, on obtient ce que l'on appelle la croissance des coûts salariaux unitaires. Même si la croissance des coûts salariaux unitaires pourrait augmenter légèrement, en réaction aux récents chocs négatifs du côté de l'offre et à la hausse de l'inflation globale, elle ne laisse pas entrevoir, à l'heure actuelle, de problème d'inflation significatif à long terme. Le contraste avec les années 1970 et 2022 est manifeste.
Figure 4 : La croissance des coûts salariaux unitaires est nettement inférieure à celle des années 70
Source : BLS, données Macrobond les plus récentes disponibles au 22 septembre 2026
Légendes : CPI toute catégorie hors alimentation et énergie/ Coûts salariaux unitaires USA
Tout en surveillant l’évolution des salaires et des coûts unitaires de main-d’œuvre, il convient de noter qu’une forte contraction des salaires réels peut contribuer à une récession, notamment lorsqu’elle s’accompagne d’un resserrement de la politique monétaire, et ainsi favoriser une désinflation à moyen terme.
La faible croissance du crédit va à l'encontre d'une inflation durablement élevée
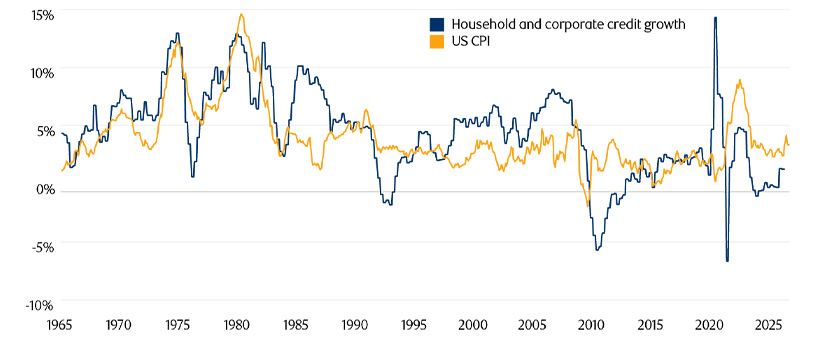
Une grande partie des dépenses, et donc de la croissance des revenus, est financée par la croissance du crédit. Par conséquent, l'écart entre la croissance du crédit et la croissance réelle de la production est étroitement lié à l'inflation. Une partie de la croissance du crédit aux ménages finit par faire grimper les prix de l'immobilier, ce qui n'est pas entièrement pris en compte dans les mesures de l'inflation, comme ce fut le cas au milieu des années 80, à la fin des années 90 et dans les années 2000, avant la crise financière mondiale.
Figure 5 : La croissance du crédit au secteur privé américain est aujourd’hui modérée
Source : Données de la BRI, du BLS et de Macrobond, dernières disponibles au 22 septembre 2026
Légendes : Croissance du crédit aux ménages et aux entreprises/CPI USA
La faible croissance du crédit contribue à expliquer pourquoi l’assouplissement quantitatif mis en place après la crise financière n’a pas entraîné d’inflation significative. En cas de contraction du crédit, il faut créer de la monnaie supplémentaire ne serait-ce que pour compenser cette contraction. C’est l’équilibre qui importe.
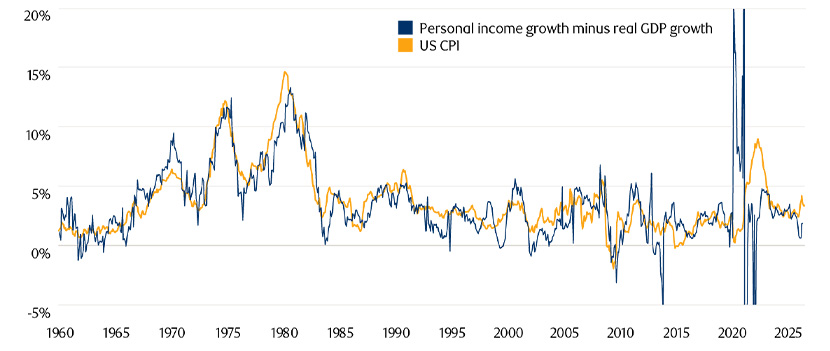
Contrairement à ce qui s’était produit après la crise financière mondiale, les mesures d’assouplissement quantitatif mises en œuvre pendant la crise du Covid ont directement financé des plans de relance budgétaire massifs, dont les fonds ont été versés aux ménages, soutenant fortement leurs revenus, notamment par le biais des transferts publics. Les dépenses liées à ces revenus supplémentaires ont ainsi contribué à une forte poussée de l’inflation. Certaines mesures de relance étaient clairement nécessaires, mais le montant attribué était excessif.
Figure 6 : La croissance du revenu des ménages (y compris par le biais de transferts publics) est importante pour l’inflation
Source : Source : BEA, BLS, Macrobond, dernières données disponibles au 22 septembre 2026
Légendes : Écart entre la croissance du revenu des ménages et celle du PIB réel /CPI USA
Aujourd’hui, la croissance globale du crédit au secteur privé américain reste relativement modérée, même si les grandes entreprises technologiques qui investissent dans l’IA s’endettent pour financer une partie de leurs dépenses d’investissement dans les centres de données, ce qui exerce des pressions à la hausse sur les prix des semi-conducteurs et de certains des produits électroniques dans lesquels ils sont intégrés.
À court terme, les chocs d’offre négatifs exercent donc à nouveau des pressions haussières sur les prix de l’énergie et pourraient bientôt en faire autant sur les prix alimentaires, tandis que l'essor des investissements dans le secteur technologique tire à la hausse les prix des puces électroniques. A moyen terme toutefois, la croissance relativement faible des coûts salariaux unitaires, la progression des revenus des particuliers par rapport à la croissance de la production réelle et la croissance globale modérée du crédit laissent penser que nous sommes loin de revenir au type de régime inflationniste observé dans les années 1970.
L’absence de mesures de relance publique financées par l’assouplissement quantitatif et la marge de manœuvre nettement plus restreinte pour réduire le taux d’épargne des ménages réduisent également de manière significative le risque de voir se reproduire le type d’inflation observé en 2021/2022. Même si nous estimons qu’une relance budgétaire significative est peu probable avant ou après les élections de mi-mandat, les récentes déclarations de l’administration américaine incitent à rester vigilant.
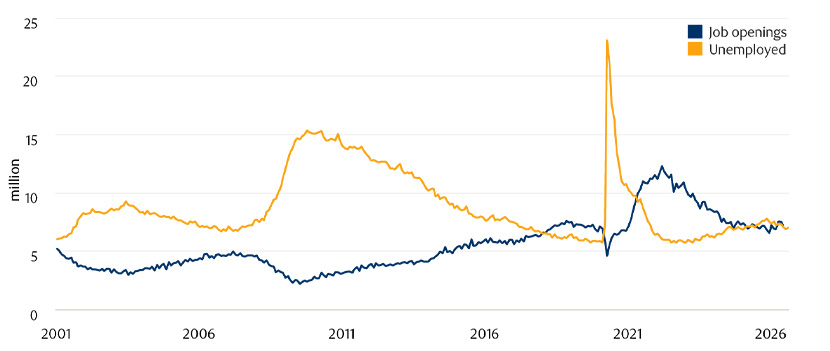
Un marché du travail moins tendu réduit également le risque d'une hausse aussi forte des coûts salariaux unitaires que celle observée en 2022. Il restera néanmoins important de surveiller attentivement l’évolution des coûts unitaires de main-d’œuvre, compte tenu d’un marché du travail qui demeure relativement tendu, même s'il s'est sensiblement assoupli depuis 2022.
Figure 7 : Le marché du travail est moins tendu qu’en 2022, mais reste néanmoins sous tension
Source : BLS, données Macrobond les plus récentes disponibles au 22 septembre 2026
Légendes : Créations d’emplois/Chômeurs
Évolution démographique/immigration vs IA
Lorsqu’on examine les différences entre la situation actuelle et celle des années 1970 et de 2022, il est également important de prendre en compte la croissance de la population active et de l’IA.
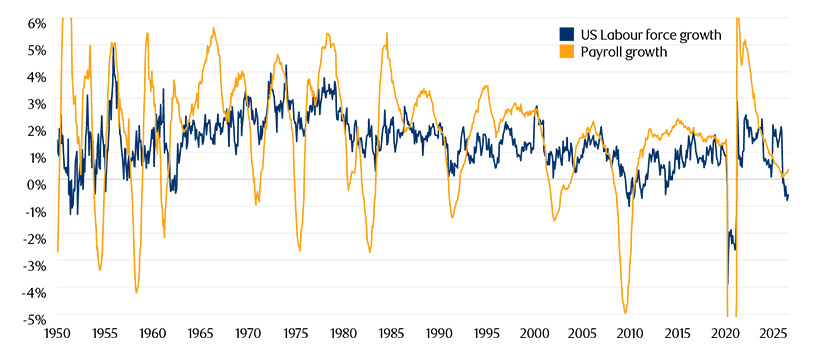
La croissance de la population active (le nombre de travailleurs disponibles) est récemment devenue négative, principalement en raison du vieillissement de la population et des mesures en matière d’immigration. L’économie étant proche de la plupart des estimations du plein emploi, il est difficile que la production réelle croisse plus vite que la productivité. Toutes choses égales par ailleurs, cela pourrait alimenter l’inflation, tout en rendant la croissance réelle plus vulnérable aux chocs négatifs du côté de l’offre.
Figure 8 : La croissance de la population active n’est plus celle des années 70
Source : BLS, Macrobond, dernières données disponibles au 22 septembre 2026.
Légende : Croissance de la main-d’œuvre USA/Croissance des salaires
Mais, en pratique, les autres facteurs restent rarement inchangés. Rappelons que lors du choc inflationniste de 2022, l’emploi augmentait rapidement et rares étaient ceux qui s’inquiétaient de voir l’IA leur prendre leur emploi.
L’IA pourrait entraîner une croissance significative de la productivité. Si ce n’est pas le cas, les dépenses d’investissement seraient probablement réduites à terme dans une mesure susceptible de provoquer une récession similaire à celle observée au début des années 2000, lorsque les bulles spéculatives liées aux dépenses d’investissement dans le secteur des technologies de l’information et au marché boursier ont éclaté.
Supposons toutefois que l’IA génère effectivement des gains de productivité, ce qui semble être le scénario le plus probable. Dans le scénario le plus optimiste, cette croissance de la productivité pourrait se faire sans perte nette d’emplois et permettre une augmentation de la production réelle et des salaires réels, tout en maintenant les coûts salariaux unitaires et l’inflation à un faible niveau.
Cependant, il est également possible que les gains de productivité permettent aux entreprises de réduire leurs effectifs. Si la baisse de l’emploi venait à dépasser la diminution de la population active, la hausse du chômage pourrait très rapidement devenir désinflationniste, voire potentiellement déflationniste.
Historiquement, les entreprises ont tendance à ne supprimer des emplois que lorsque leurs bénéfices sont sous pression. On observe cependant déjà des cas d’entreprises qui suppriment des emplois tout en investissant dans l’IA, alors que leurs bénéfices (même si ce n’est pas toujours le flux de trésorerie disponible) continuent de progresser.
Les investisseurs ne doivent donc pas sous-estimer le risque que l’IA puisse entraîner des suppressions nettes d’emplois. Ils doivent également garder à l’esprit que les coûts des salariés d’une entreprise constituent les revenus et les recettes d’autres entreprises.
Dans l’ensemble, si les investisseurs doivent rester attentifs aux risques de hausse de l’inflation à court terme liés à l’augmentation des prix de l’alimentation, de l’énergie et des semi-conducteurs, susceptible d’accélérer la progression des salaires et des coûts unitaires de main-d’œuvre, nous estimons néanmoins peu probable un retour à une inflation durablement élevée comparable à celle des années 1970.
La réponse des politiques publiques compte
Bien entendu, la réponse conjointe des politiques monétaire et budgétaire, tant face aux pressions haussières à court terme sur l’inflation que face au potentiel désinflationniste de l’IA à moyen terme, sera également un facteur important à prendre en compte et à suivre pour évaluer les perspectives d’inflation à moyen et long terme.
Les autorités peuvent toujours juguler l’inflation en relevant suffisamment les taux d’intérêt ou les impôts. À l’inverse, elles peuvent toujours provoquer de l’inflation en créant et en injectant suffisamment de monnaie dans l’économie. À moyen et long terme, il faudra également examiner attentivement l’efficacité des baisses de taux si l’IA venait à entraîner des pertes nettes d’emplois. Il convient également de prendre en compte la possibilité d'un plan de relance budgétaire financé par l'assouplissement quantitatif, ainsi que son ampleur.
Nous sommes toutefois conscients que, bien que le nouveau président de la Fed, M. Warsh, se soit montré ouvert par le passé à l’idée d’une baisse des taux en raison des gains de productivité générés par l’IA, il est farouchement opposé, sur le plan idéologique, à toute expansion du bilan de la Fed en dehors des besoins de liquidité d’urgence. Peu après la crise financière, il avait vivement protesté et démissionné de la Fed en raison de la poursuite de nouvelles vagues d’assouplissement quantitatif, craignant que cela ne provoque de l’inflation. Il faut garder à l'esprit qu'à l'époque, le chômage restait très élevé et que la croissance du crédit était très faible.
Le niveau élevé de la dette publique par rapport au PIB et l'aggravation des déficits budgétaires primaires dans de nombreux pays, associés à l'impact de l'IA sur les recettes publiques, les coûts d'emprunt et d'autres dépenses, sont également susceptibles, à terme, d'influencer les politiques monétaire et budgétaire et, par conséquent, les perspectives d'inflation à long terme ; il est donc important de les prendre en compte et de les surveiller.
Ne pas rester ancré dans le passé
Le point essentiel à retenir est que, même si l’inflation augmente à court terme, le retour à un contexte marqué par des chocs d’offre négatifs plus fréquents ne signifie pas pour autant que nous allons forcément retrouver le régime inflationniste des années 1970. Après tout, l’IA a le potentiel de constituer un énorme choc positif sur l’offre, qui pourrait également entraîner une baisse substantielle de la demande de main-d’œuvre.
En résumé, si l’inflation et les taux d’intérêt peuvent augmenter à très court terme, comme l’anticipent les marchés, ils pourraient en revanche reculer assez fortement à moyen terme. De plus, l’interaction entre l’intelligence artificielle, la robotique, l’évolution démographique et l’endettement, ainsi que les réponses politiques, budgétaires et monétaires qui en découleront, détermineront probablement les perspectives d’inflation à long terme. Les investisseurs doivent toutefois réfléchir attentivement à la chronologie des risques liés à l’inflation et aux taux d’intérêt, sans négliger les risques haussiers à court terme, les risques baissiers à moyen terme, ni les multiples scénarios possibles à long terme. Pour les investisseurs, il sera nécessaire de faire preuve de souplesse et de disposer d’un cadre clair pour évaluer les perspectives d’inflation.
Si l’étude du passé est essentielle pour cerner les similitudes et les différences entre hier et aujourd’hui, ainsi que leurs implications potentielles, il est très possible que l’avenir soit très différent de ce que nous avons connu jusqu’à présent.
Implications pour les investissements
- Les anticipations de marché concernant l’inflation aux États-Unis nous semblent actuellement un peu basses, compte tenu des risques haussiers à court terme pesant sur l’inflation.
- Toutefois, les investisseurs ne doivent pas en conclure que la combinaison de chocs d’offre négatifs et d’une hausse des rendements obligataires annonce un retour aux niveaux d’inflation et de taux d’intérêt des années 1970.
- Compte tenu des risques, notamment liés à l’IA, d’une évolution de l’inflation dans un sens comme dans l’autre à moyen et long terme, les investisseurs obligataires devront tenir compte de la succession des risques d’inflation et faire preuve de souplesse.
- Une panoplie d’outils d’investissement variée, permettant de se positionner en fonction de l’évolution de la courbe des taux, mais aussi de s’adapter à la fois à une hausse et à une baisse de l’inflation, pourrait aider les investisseurs obligataires au cours des prochaines années.