


Location
Please select your investor type by clicking on a box:
Terms & conditions
We are unable to market if your country is not listed.
You may only access the public pages of our website.


There are several misconceptions of EMD that exist. To help investors make a more informed decision, we explore the reality behind the myths.
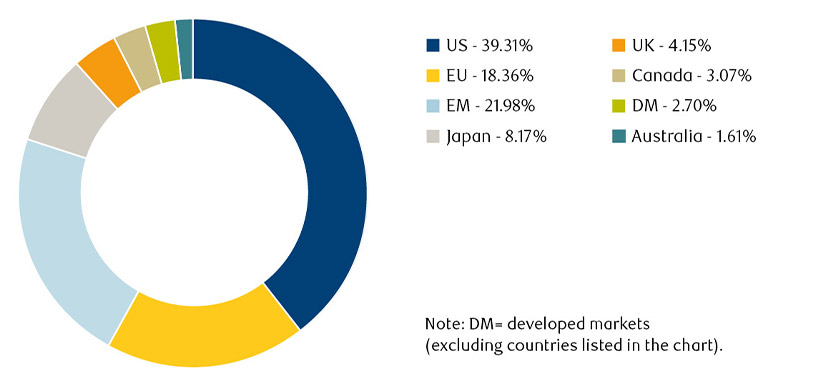
When investors hear EMD, many think small and niche. This is not the case. EM debt has become the largest pool of credit in the world, according to the Bank for International Settlements, surpassing the US over the past decade. Some people may be surprised to learn that the total market size is over $29 trillion in total debt, as of 31 October 2024, according to the Institute for International Finance.
To put that into perspective, the size of the US High Yield market is roughly $3 trillion2 and the US Investment Grade (IG) market is about $8 trillion3. These are both very mainstream asset classes that often form large parts of client portfolios, yet both are dwarfed by EMD.
Source: Bank of International Settlements (BIS)
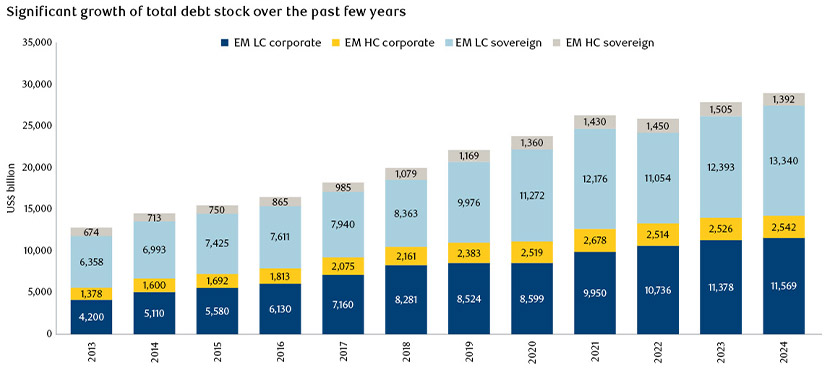
Over the past decade, the EM asset class has more than doubled in size (see Figure 2). The overall expansion highlights the deepening and maturing of EMD and the growing presence of EM countries and corporations, as they have increasingly turned to global markets to raise capital. It is worth noting, however, that this is not simply due to the largest countries and companies issuing more and more debt.
In fact, the growth is being driven by a widening range of market participants becoming more integrated into global capital markets. Moreover, because of the size and breadth of maturity profiles within issuers’ yield curves, investors can access deep, liquid markets with a broad choice of individual instruments for their investment objectives.
Source: JPMorgan, as at 31 December 2024.
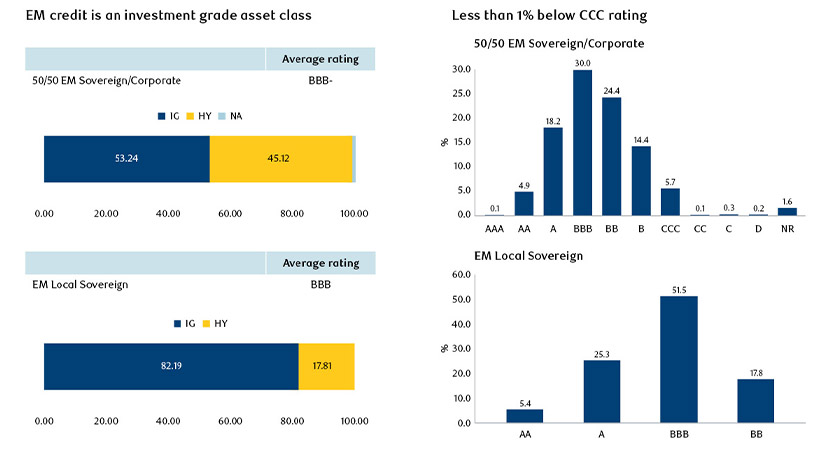
Investors may be surprised to know that, on average, the EMD asset class has an investment grade rating. The narrative seems to be that it is inherently more risky and poorly rated, but that is simply not the case.
Because of the geographical breadth of the asset class, various headlines, often pertaining to a small component of the index, can dominate perceptions of the overall asset class. As a result, emerging markets have, at times, been cast in shadows by investor apprehension. Whilst this dynamic can create opportunities, it can also make investors who are unfamiliar with the asset class reluctant to dip their toes into the market.
Indeed, supported by robust reserves and strong financial discipline, emerging markets creditors have developed mechanisms to address market fluctuations, revealing their strategic strength when it comes to meeting funding requirements. EMD default rates are lower, and recovery rates are higher than for developed markets, challenging the notion that it’s a riskier financial frontier.
Of course, there is a broad range of credit quality in the market, as shown below, providing ample opportunity for active investors to uncover opportunities.
Source: RBC Global Asset Management and Bloomberg as of 31 December 2024.
There will always be some emerging market headlines that make the front page of the Wall Street Journal or the Financial Times. But for every one or two stories that make headlines for all the wrong reasons, there are another 80+ countries that do not, given the breadth of the market. These countries are generally fundamentally sound and on an upward trajectory, make good investments and paying attractive levels of yield relative to the risks.
Contrary to the historical norm, emerging market sovereigns showcase strong fundamental economic metrics compared to developed markets countries and represent a fast-growing share of global GDP. While developed markets grappled with a higher debt-to-GDP ratio of 126.5%, emerging markets had a moderate 69.4% debt-to-GDP ratio, on average (Figure 4). Emerging market fundamentals also look compelling relative to developed markets across a range of additional metrics, including fiscal deficits and current account deficits.
Source: IMF projections as of October 2024
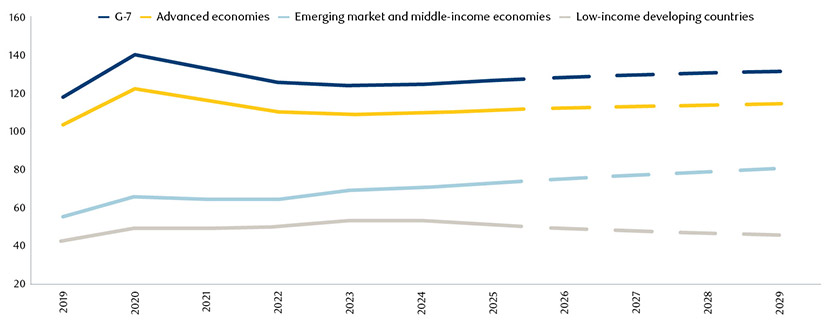
Despite global challenges in recent years, such as supply chain disruptions, inflationary pressures, and geopolitical uncertainties, EM economies have demonstrated healthy resilience. Many EM countries have implemented sound fiscal and monetary policies over the last few years, building stronger macroeconomic foundations that will lower gross financing needs (Figure 5).
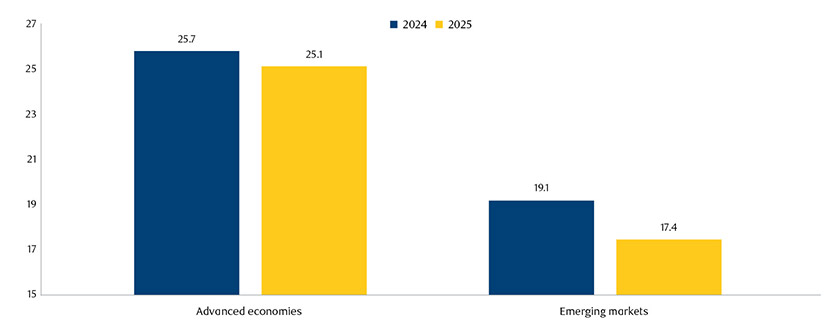
Source: IMF projections as at December 2024. Weighted average GFNs for advanced economies and emerging markets. GFNs are defined as the sum of the primary deficit, debt service, and the stock of short-term debt at the end of the previous period, plus other debt-creating or reducing flows.
As a result, we have seen a decisively positive trend in EM sovereign ratings recently (Figure 6).
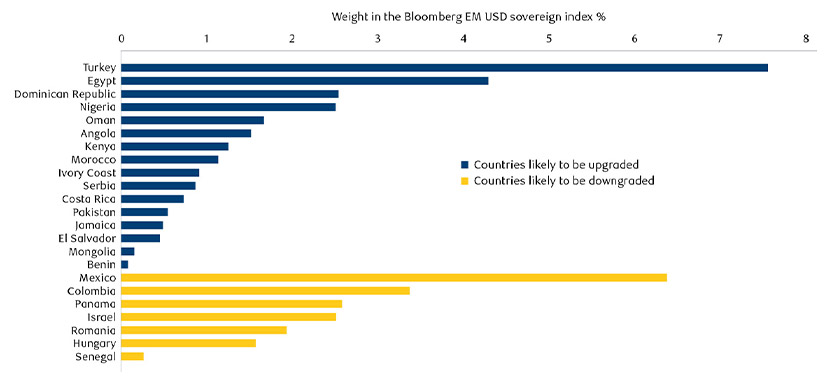
Source: Barclays Research. The chart shows countries that are expected to receive at least one rating upgrade/downgrade by any of the three major rating agencies up to year-end 2025. Default/ recent restructuring situations excluded. Please note that El Salvador was updated as of 7 January 2025. The foreign currency debt rating was upgraded by Fitch to B-, making it the equivalent of B- across all major rating agencies.
In addition, EM corporates entered 2025 from a position of strength. The high default rates of the post-Covid era, which were largely driven by the Chinese property crisis along with a steady stream of negative geopolitical events, are now behind us, with EM corporates going through a sharp de-leveraging event as a result. We expect corporate defaults to be in line with US markets and meaningfully lower than Europe.
EMD is a huge and established asset class that can offer enhanced yields, diversification and excess returns. That's why we believe it should form part of any core bond portfolio. However, EMD shouldn't be treated homogeneously and investors need specialised expertise to manage assets effectively in this asset class.
1, 2, 3 JPMorgan, RBC BlueBay Asset Management, as of December 2024.
Subscribe now to receive the latest investment and economic insights from our experts, sent straight to your inbox.
This document is a marketing communication and it may be produced and issued by the following entities: in the European Economic Area (EEA), by BlueBay Funds Management Company S.A. (BBFM S.A.), which is regulated by the Commission de Surveillance du Secteur Financier (CSSF). In Germany, Italy, Spain and Netherlands the BBFM S.A is operating under a branch passport pursuant to the Undertakings for Collective Investment in Transferable Securities Directive (2009/65/EC) and the Alternative Investment Fund Managers Directive (2011/61/EU). In the United Kingdom (UK) by RBC Global Asset Management (UK) Limited (RBC GAM UK), which is authorised and regulated by the UK Financial Conduct Authority (FCA), registered with the US Securities and Exchange Commission (SEC) and a member of the National Futures Association (NFA) as authorised by the US Commodity Futures Trading Commission (CFTC). In Switzerland, by BlueBay Asset Management AG where the Representative and Paying Agent is BNP Paribas Securities Services, Paris, succursale de Zurich, Selnaustrasse 16, 8002 Zurich, Switzerland. The place of performance is at the registered office of the Representative. The courts at the registered office of the Swiss representative or at the registered office or place of residence of the investor shall have jurisdiction pertaining to claims in connection with the offering and/or advertising of shares in Switzerland. The Prospectus, the Key Investor Information Documents (KIIDs), the Packaged Retail and Insurance-based Investment Products - Key Information Documents (PRIIPs KID), where applicable, the Articles of Incorporation and any other document required, such as the Annual and Semi-Annual Reports, may be obtained free of charge from the Representative in Switzerland. In Japan, by BlueBay Asset Management International Limited which is registered with the Kanto Local Finance Bureau of Ministry of Finance, Japan. In Asia, by RBC Global Asset Management (Asia) Limited, which is registered with the Securities and Futures Commission (SFC) in Hong Kong. In Australia, RBC GAM UK is exempt from the requirement to hold an Australian financial services license under the Corporations Act in respect of financial services as it is regulated by the FCA under the laws of the UK which differ from Australian laws. In Canada, by RBC Global Asset Management Inc. (including PH&N Institutional) which is regulated by each provincial and territorial securities commission with which it is registered. RBC GAM UK is not registered under securities laws and is relying on the international dealer exemption under applicable provincial securities legislation, which permits RBC GAM UK to carry out certain specified dealer activities for those Canadian residents that qualify as "a Canadian permitted client”, as such term is defined under applicable securities legislation. In the United States, by RBC Global Asset Management (U.S.) Inc. ("RBC GAM-US"), an SEC registered investment adviser. The entities noted above are collectively referred to as “RBC BlueBay” within this document. The registrations and memberships noted should not be interpreted as an endorsement or approval of RBC BlueBay by the respective licensing or registering authorities. Not all products, services or investments described herein are available in all jurisdictions and some are available on a limited basis only, due to local regulatory and legal requirements.
This document is intended only for “Professional Clients” and “Eligible Counterparties” (as defined by the Markets in Financial Instruments Directive (“MiFID”) or the FCA); or in Switzerland for “Qualified Investors”, as defined in Article 10 of the Swiss Collective Investment Schemes Act and its implementing ordinance, or in the US by “Accredited Investors” (as defined in the Securities Act of 1933) or “Qualified Purchasers” (as defined in the Investment Company Act of 1940) as applicable and should not be relied upon by any other category of customer.
Unless otherwise stated, all data has been sourced by RBC BlueBay. To the best of RBC BlueBay’s knowledge and belief this document is true and accurate at the date hereof. RBC BlueBay makes no express or implied warranties or representations with respect to the information contained in this document and hereby expressly disclaim all warranties of accuracy, completeness or fitness for a particular purpose. Opinions and estimates constitute our judgment and are subject to change without notice. RBC BlueBay does not provide investment or other advice and nothing in this document constitutes any advice, nor should be interpreted as such. This document does not constitute an offer to sell or the solicitation of an offer to purchase any security or investment product in any jurisdiction and is for information purposes only.
No part of this document may be reproduced, redistributed or passed on, directly or indirectly, to any other person or published, in whole or in part, for any purpose in any manner without the prior written permission of RBC BlueBay. Copyright 2026 © RBC BlueBay. RBC Global Asset Management (RBC GAM) is the asset management division of Royal Bank of Canada (RBC) which includes RBC Global Asset Management (U.S.) Inc. (RBC GAM-US), RBC Global Asset Management Inc., RBC Global Asset Management (UK) Limited and RBC Global Asset Management (Asia) Limited, which are separate, but affiliated corporate entities. ® / Registered trademark(s) of Royal Bank of Canada and BlueBay Asset Management (Services) Ltd. Used under licence. BlueBay Funds Management Company S.A., registered office 4, Boulevard Royal L-2449 Luxembourg, company registered in Luxembourg number B88445. RBC Global Asset Management (UK) Limited, registered office 100 Bishopsgate, London EC2N 4AA, registered in England and Wales number 03647343. All rights reserved.
Subscribe now to receive the latest investment and economic insights from our experts, sent straight to your inbox.
Please choose from the following
We are unable to market if your country is not listed.
You may only access the public pages of our website.