Looking beyond the largest developed market currencies, Dan Mitchell, CFA, Senior Portfolio Manager for RBC GAM, discusses a role for the Australian dollar as part of a preferred group of commodity-linked currencies that may offer greater protection in an inflationary world.
Key takeaways:
- Despite major geopolitical events, changing global trade patterns and investors rebalancing their portfolios, currency markets have so far this year been much less volatile than investors might have expected.
- We expect the U.S. dollar to soften in the year ahead, with its recent range-bound behaviour reflecting a number of headwinds in our view, including purchasing power parity (PPP) valuation, capital flow dynamics, interest rate differentials and overseas central bank intervention.
- As a result, we are becoming more discerning on currency positioning, with higher oil prices in particular increasing the focus on country terms of trade, while political developments and fiscal and monetary policies may increasingly drive currencies.
- Within developed markets, we have grown more cautious on the largest and most liquid currencies – the euro, yen and pound – instead preferring growth-oriented, commodity-linked currencies including the Australian dollar, alongside the Norwegian krone and the Canadian dollar.
- We see these three commodity-linked currencies as better insulated from the global energy shock and – supported by stronger fiscal and trade balances than their peers – potentially better positioned in an inflationary world.
- The Australian dollar, in particular, is well positioned to build on its strong performance so far this year – supported by the country’s relatively more robust macroeconomic position, recent foreign direct investment and portfolio inflows, and attractive bond yields.
An unusual currency-markets pattern
Currency markets this year have departed from the usual pattern that investors might normally associate with periods of economic uncertainty and heightened geopolitical stress. Indeed, some 50 years of freely floating exchange rates have taught us that these are typically the times when currencies tend to move most: major economic upheavals, such as the 2008 Global Financial Crisis or the 2020 Covid pandemic, have traditionally been times to buy the U.S. dollar in particular given its long-standing safe-haven status.
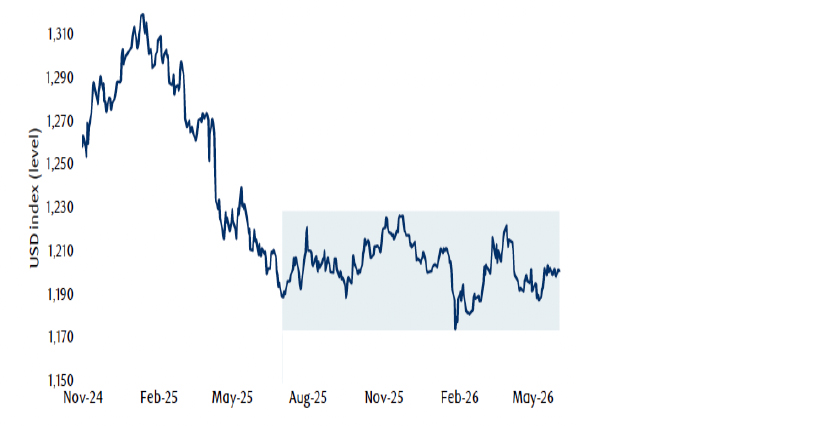
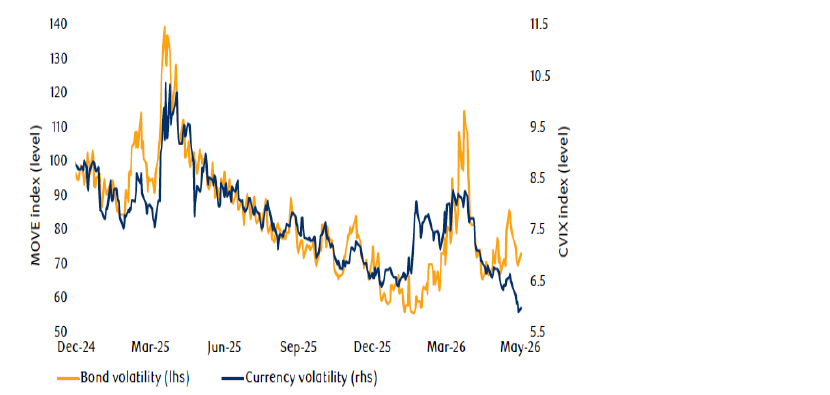
So it is interesting that the U.S. dollar did not get much of a boost when the U.S. launched missile strikes on Iran in late February. As well as broader geopolitical concerns, the higher oil prices that followed the shuttering of the Strait of Hormuz – a major chokepoint for around one-fifth of the world’s oil shipments – should also have been U.S. dollar-supportive, given that the country is the world’s largest oil producer. Instead, the U.S. dollar has been range-bound for the past year (Exhibit 1), while currency markets more broadly have exhibited lower volatility (Exhibit 2).
Exhibit 1: A range-bound U.S. dollar
Source: RBC GAM, Bloomberg, as at 2 June 2026.
Exhibit 2: Currency volatility falls
Source: RBC GAM, DB, Bank of America, Bloomberg, as at 1 June 2026.
A changing U.S. dollar playbook
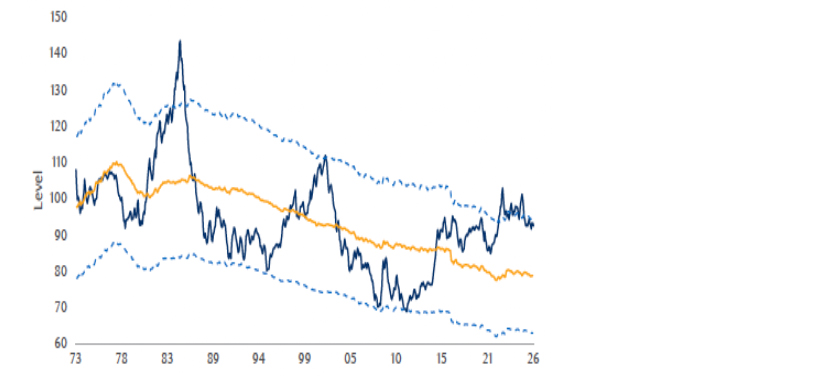
In our view, that range-bound U.S. dollar behaviour reflects a number of key headwinds. One is valuation, where the currency looks expensive on a PPP basis (Exhibit 3). Another is investor sentiment, which has become more bearish toward the U.S. dollar as U.S. policymakers have arguably undermined the currency’s role in global investment and trade – whether by freezing the foreign exchange reserves of adversaries, imposing aggressive tariffs on trade partners or threatening withdrawal from global security alliances.
The U.S. dollar’s safe-haven role has also become less straightforward. A currency’s behaviour as a safe haven is dictated by the magnitude and direction of capital flows during periods of risk aversion. In past crises, the U.S. dollar was supported because the U.S. ran positive net equity and direct investment balances, meaning investors and corporations in the U.S. owned more assets abroad than foreigners owned in U.S. assets – as a result, the repatriation of foreign capital back to the U.S. during times of market stress was generally a positive for the U.S. dollar.
Exhibit 3: U.S. dollar looks expensive versus PPP
Source: RBC GAM, Bloomberg, as at 31 May 2026.
Since 2018, however, that balance has flipped, and foreign investors now hold larger investments in the country. Likely owing to superior U.S. equity performance over much of the past decade, foreign ownership in U.S. stocks is thought by some estimates to be as large as USD30 trillion. At that scale, arguably even a small degree of capital repatriation by foreign investors may be sufficient to weaken the U.S. dollar.
The currency also looks less compelling on interest rate differentials. As some other central banks globally have proved to be quicker than the Federal Reserve to pivot toward tightening monetary policy, this has eroded some of the U.S. dollar’s yield advantage relative to other G10 economies since last year.
Currency intervention has been a further factor. In Asia, policymakers have stemmed U.S. dollar gains through intervention, notably in Japan, but also in India and Indonesia.
Together, these various dynamics support our expectation for the U.S. dollar to soften in the year ahead, but that is only part of a more nuanced currency market outlook.
A more discerning currency market
While a U.S. dollar view clearly matters, that does not mean that currency positioning should be reduced to a simple U.S. dollar call. Indeed, a softer U.S. dollar does not automatically favour all developed market currencies equally. Instead, we think the current environment highlights a need to be more discerning about which currencies to hold and why.
The higher oil prices that we have seen this year are a key reason for that selectivity. With energy inflation risks once again in focus, this is prompting markets to consider individual countries’ terms of trade, how oil subsidies, for example, might impact countries’ fiscal balances and how their central banks may respond when inflation pressures risk prompting potentially growth-damaging interest rate hikes.
Currency preferences
Within the developed market currency universe, we have grown more cautious on the biggest and most liquid currencies: the euro, yen and pound. Instead, we prefer those currencies that belong to economies that are more growth-oriented and commodity-linked: in particular, we would highlight the Australian dollar, alongside the Norwegian krone and the Canadian dollar.
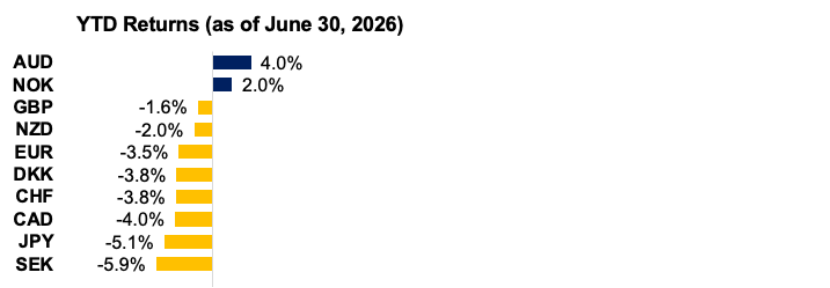
Importantly, commodity-linked currencies may offer greater protection in an inflationary world as they are linked to economies that export commodities whose prices may rise alongside both inflation and a softer U.S. dollar (Exhibit 4).
Exhibit 4: U.S. dollar currency performance this year
Source: RBC GAM, Bloomberg, as at 30 June 2026.
The case for commodity-linked currencies
The appeal of currencies like the Australian dollar is not only that they may be better insulated from global energy price shocks, but that – along with the Norwegian krone and Canadian dollar – they are supported by stronger fiscal and trade balances than their peers (Exhibits 5 and 6).
Exhibit 5: A relative fiscal advantage
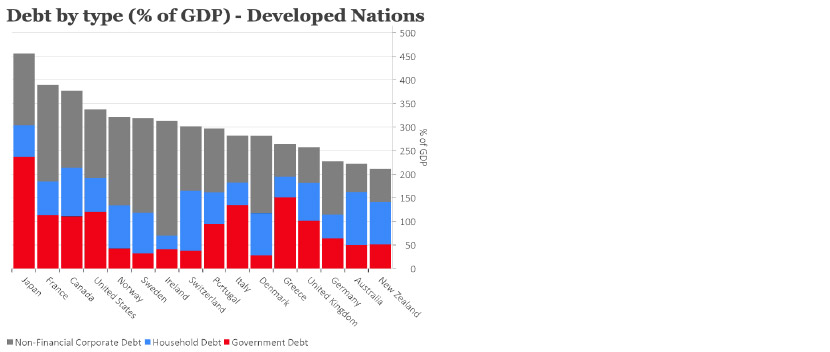
Source: IMF, latest data as of 2024.
Exhibit 6: Change in commodity terms of trade
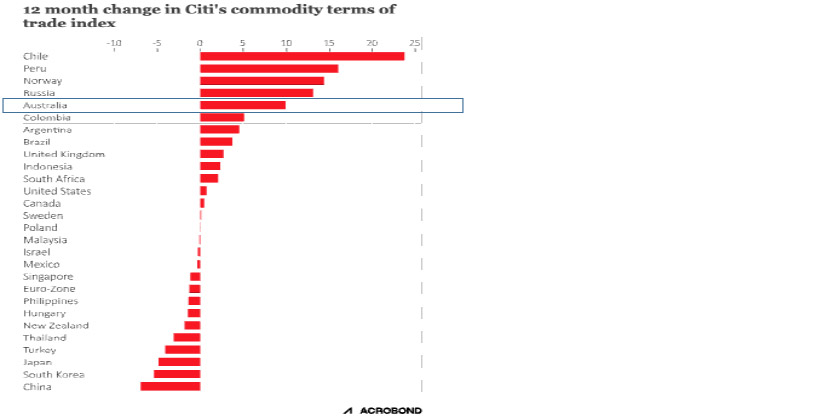
Source: Citibank, as at 22 July 2026.
The case for the Australian dollar
Investors tend to allocate capital to regions where they can earn better risk-adjusted returns. Given Australia’s more responsible fiscal stance in particular, the country’s higher interest rates arguably make its bonds an attractive investment destination, and one which in turn could also support the currency.
Yet judging from Australia’s currency valuation (Exhibit 7), the currency’s strength seen so far this year may have further to run to more fully reflect this relative yield premium – not least given a tailwind of Australian dollar demand driven by recent foreign direct investment and portfolio inflows (Exhibit 8).
Exhibit 7: Australian dollar PPP valuation
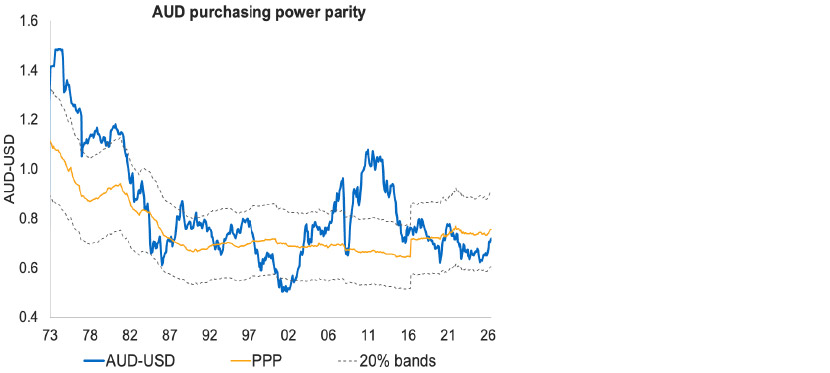
Source: RBC GAM, Bloomberg, as at 30 June 2026.
Exhibit 8: A positive net balance of flows
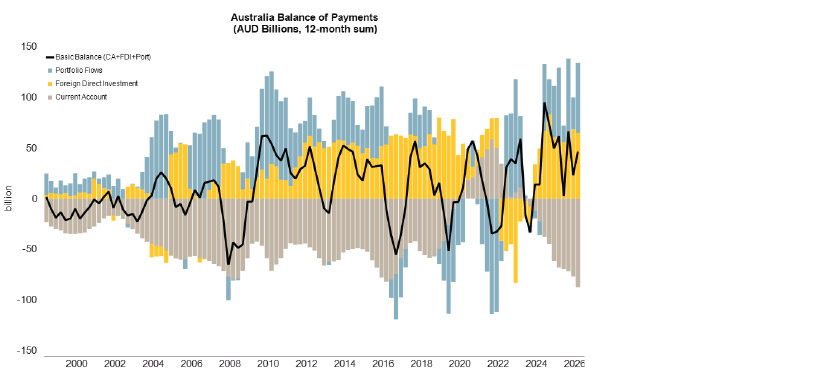
Source: RBC GAM, Australia Bureau of Statistics, Macrobonds, as at Q1 2026.
In sum, for investors looking beyond the largest developed market currencies, this combination of factors helps explain why, in our view, the Australian dollar – as part of a preferred commodity-linked group – may have a bigger role to play within investors’ portfolios.