

Location
Please select your investor type by clicking on a box:
We are unable to market if your country is not listed.
You may only access the public pages of our website.


China’s economic data continues to undershoot expectations (see next chart).
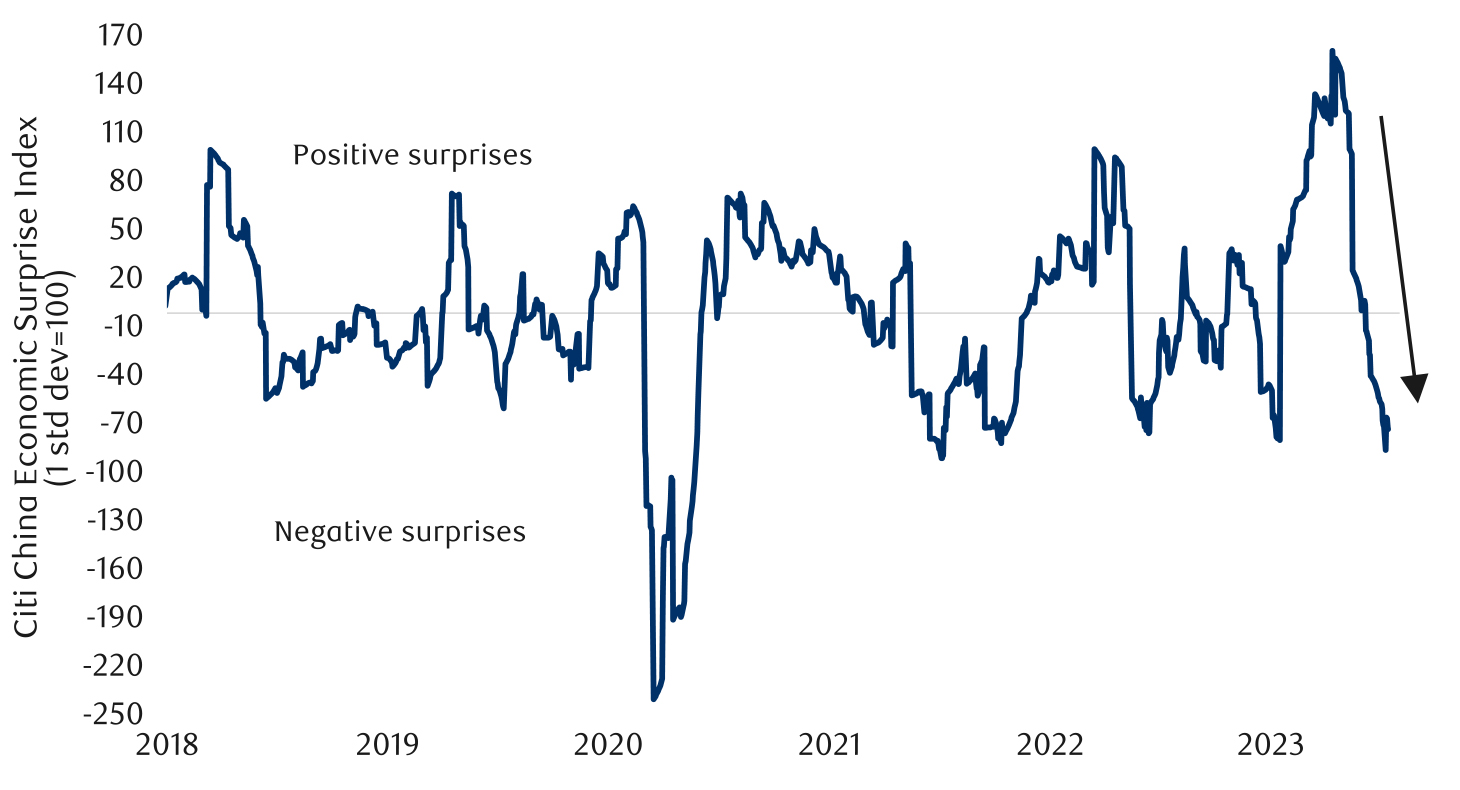
As of 07/14/2023. Sources: Citigroup, Bloomberg, RBC GAM
The country just reported a weak second-quarter Gross Domestic Product (GDP) print that was up just 0.8% relative to the prior quarter (around +3% on an annualized basis). Industrial production and retail sales are merely 4% and 3% higher than the year before, respectively. Indeed, a wide range of Chinese economic indicators are trending downward or otherwise soft (see next chart).
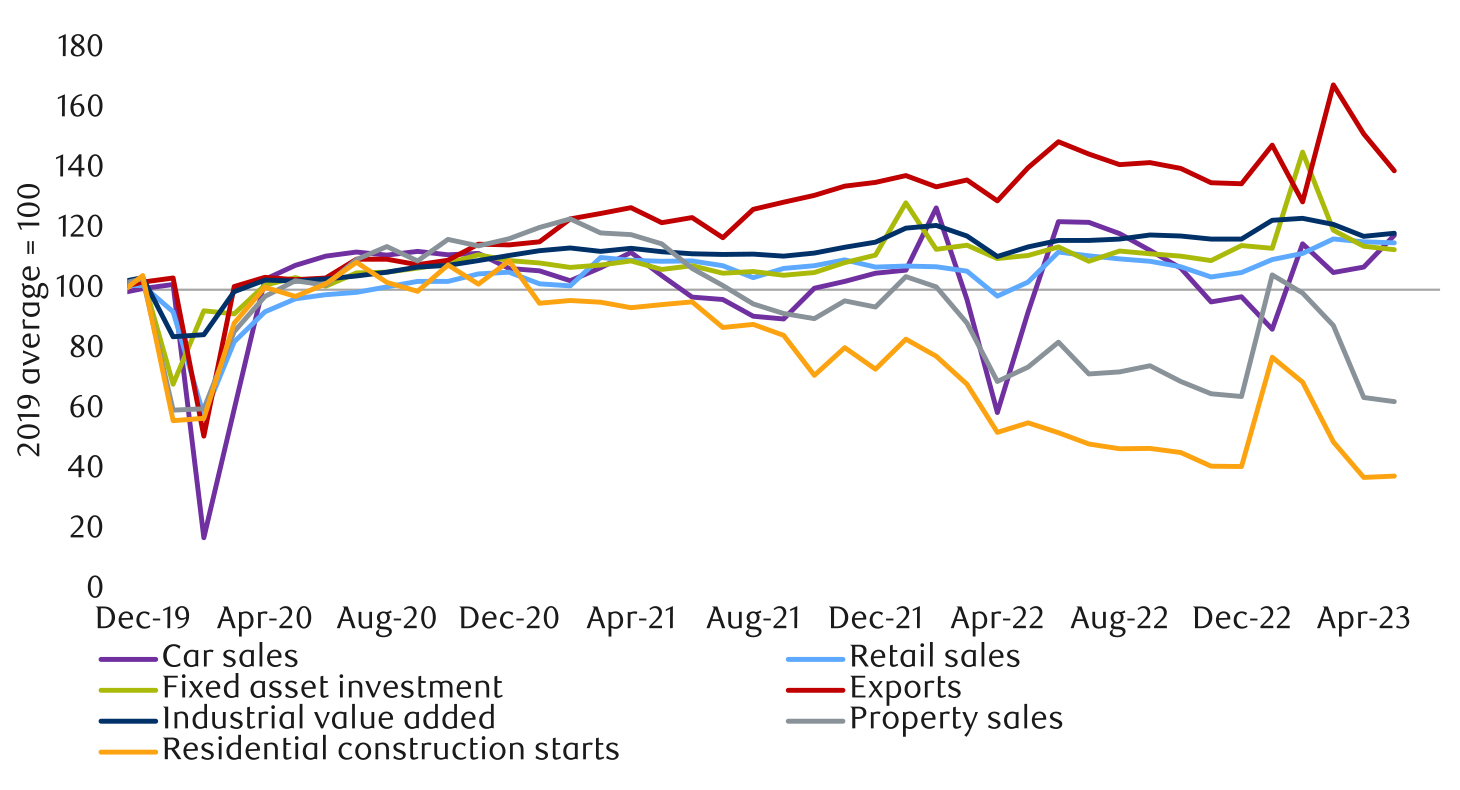
As of May 2023. Average of 2019 indexed to 100. Sources: Haver Analytics, RBC GAM
We continue to anticipate more Chinese stimulus coming in response to this. China is hardly in an enviable position with regard to its economic situation, but at least it has the coherence of a weak economy and low inflation both arguing for the same policy solution.
Any further policy support is unlikely to be of the shock-and-awe variety that the U.S. is famous for, but rather targeted measures that tilt more toward rule changes than monetary outlays. For example:
In turn, whereas there was too much optimism about China at the start of 2023, there is now arguably too much pessimism about the country.
The dock workers at 30 British Columbia ports recently staged a 13-day strike. This left as many as 63,000 shipping containers stranded on ships and disrupted around C$10 billion in trade. It goes without saying that the strike will temporarily reignite supply chain woes within Canada. Some products will be harder to procure, the economy will be slightly weaker, and inflation may be slightly higher.
However, the effects are temporary, and the economic cost is much less than C$10 billion. That represents the value of the goods impeded from transiting through the ports. But those goods will eventually reach their destinations. Furthermore the value-added normally provided by the ports for these goods is much less than C$10 billion. Shipping a million-dollar piece of equipment through a port does not add a million dollars to GDP – producing the equipment generates most of that sum, and the shipping value-added is comparatively modest.
Of course, to the extent businesses were counting on receiving their delayed goods, there is also a temporary loss via their diminished ability to operate normally.
One academic estimate puts the damage to Canadian annual economic output on the order of -0.02% – a tiny sum. But this damage could prove visible in the monthly economic data, temporarily subtracting 0.2% from a single month’s output before that loss is reclaimed in subsequent months. The effect could well be a percentage point or more off of British Columbia’s monthly economic output, though again only on a temporary basis. The effect on inflation is less clear, but one would imagine no more than a few tenths of a percentage point of temporary extra inflation.
While economic data remains far from bad, the major data releases for June tilted slightly negative. The Institute for Supply Management (ISM) Services index continued its choppy sideways pattern. The ISM Manufacturing index remains outright weak and on a slight downward trend. It is already consistent with a contracting manufacturing sector, and only a few notches from the point at which the broader economy usually joins in (see next chart).
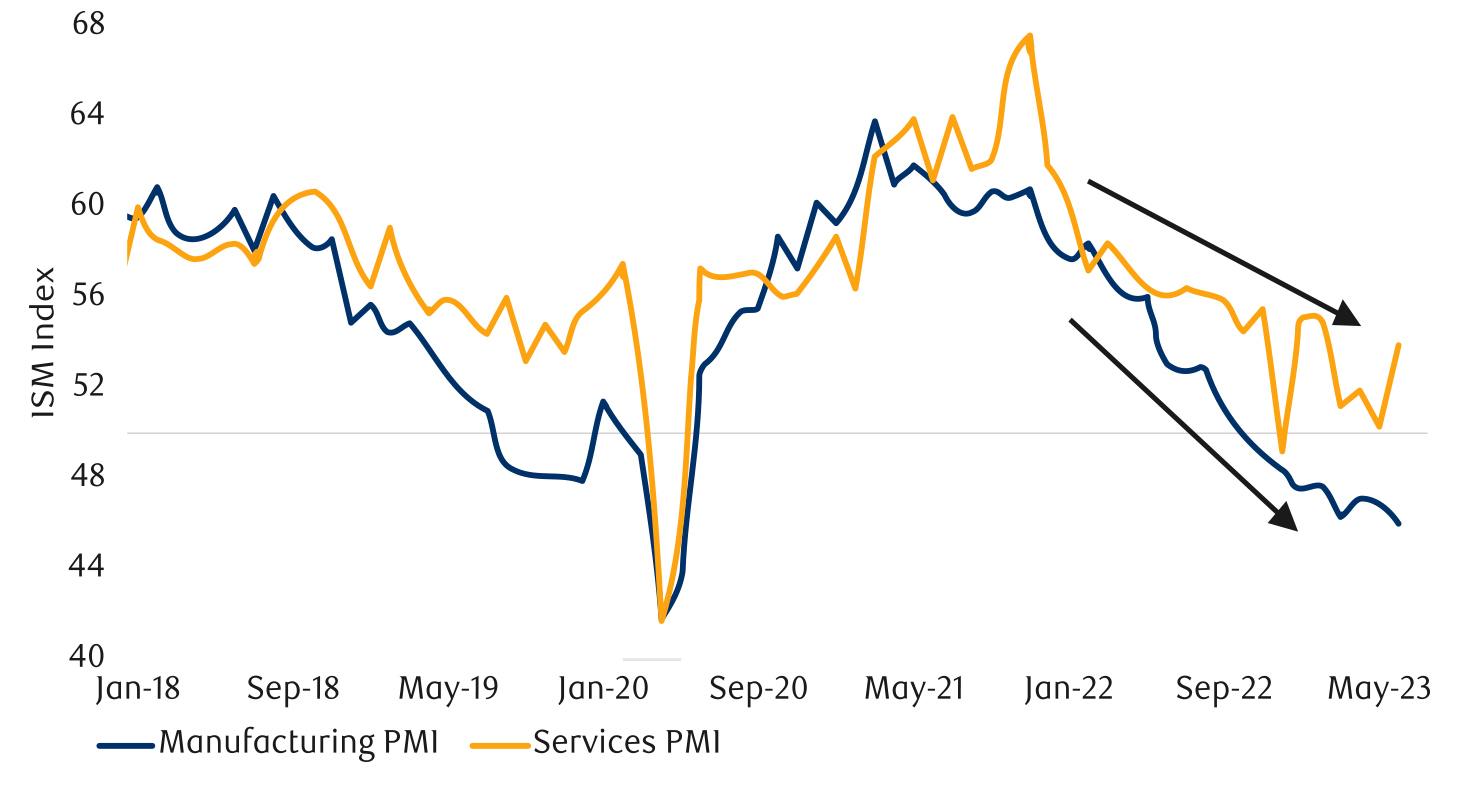
As of June 2023. Shaded area represents recession. Sources: Institute for Supply Management, Haver Analytics, RBC GAM
The U.S. job numbers were similarly weaker for June. There was nothing wrong about the 209,000 new jobs created in an absolute sense – it is entirely enough to keep the economy moving – but most other aspects of the report encouraged a worse interpretation. The figure was below the consensus forecast. It was almost 100,000 jobs weaker than the prior month (see next chart). In fact, it was the softest single month of job creation in two and a half years. There were also 110,000 of downward revisions to the prior two months.
Additionally, the jobs that were created in June were skewed toward government, health care and social assistance jobs. These are perfectly fine jobs, but not the sort of hiring that signals business leaders are feeling great confidence about the future. In other sectors, we continue to track gradually deteriorating U.S. jobless claims and job openings.
North of the border, Canadian employment managed to add an impressive 60,000 new jobs in June (with +110,000 full-time positions added and 50,000 part-time positions lost). However, the ebullience with which this should be interpreted must be tempered by the prior month’s 17,000 job losses and the fact that with roughly a million people per year currently moving to Canada, the country theoretically needs to add upwards of 50,000 new jobs per month just to keep pace. Reflecting this second observation, the unemployment rate actually rose from 5.2% to 5.4% in June, a further increase from the 5.0% low recorded in April. Like the U.S., job creation was also tilted toward sectors that say less about business sentiment: health, education and public administration.
Elsewhere, while Canadian GDP growth was reported at just 0.0% in April, preliminary indicators pointed to a large 0.4% gain in May. Conversely, the Bank of Canada’s Business Outlook Survey was considerably more sour. For example:
Inflation-adjusted consumer spending continues to make incremental gains (see next chart).
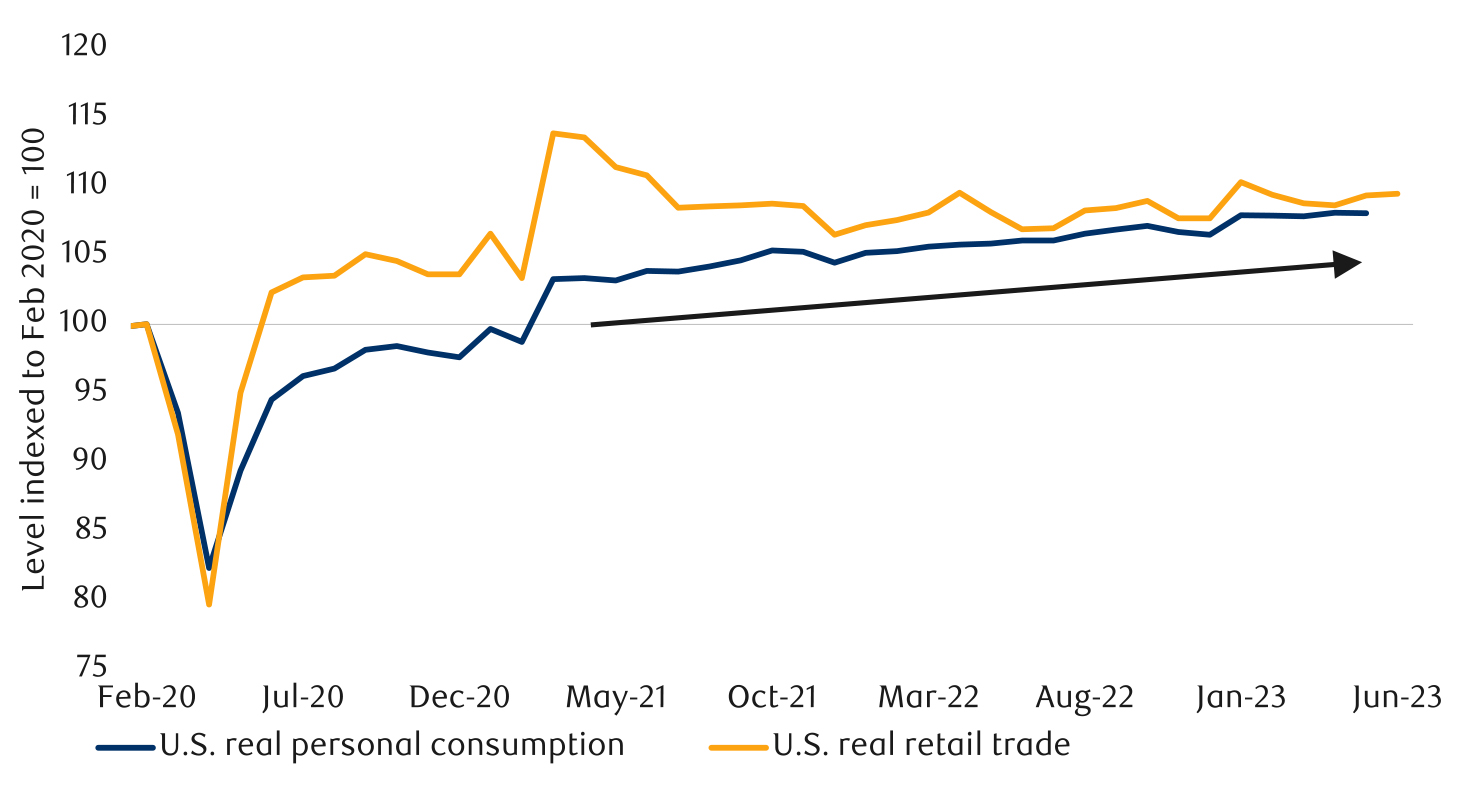
Personal consumption as of April 2023, retail sales as of May 2023. Sources: U.S. Bureau of Economic Statistics, U.S. Bureau of Labor Statistics, U.S. Census Bureau, Macrobond, RBC GAM
From a theoretical standpoint, this shouldn’t be happening. Consumers should be ready to put away their wallets. Stimulus cheques have largely vanished. Inflation has eroded consumer purchasing power. Higher interest rates have likewise eaten their disposable income, outmuscling robust job creation over the past few years. The U.S. personal savings rate is now unusually low and credit card borrowing is surging at more than 15% per year.
It was thus with great interest that we now see companies remarking on diminishing consumer enthusiasm. Not all of this is new: lower-end retailers have been capturing market share from mid-tier retailers for over a year. But the latest Amazon Prime Day revealed deeper discounts than usual. This was a boon to shoppers, but also a signal that consumers are being more fickle. Other signs include:
In the immediate future, 45 million Americans will experience an abrupt (average) $400 per month increase in their expenses as student loan payments resume after a long pandemic pause. This means $70 billion in annual payments will resume, chopping approximately 0.6% from personal income and around 0.2% from personal spending.
The Biden Administration’s effort to eliminate some outstanding student loans altogether was recently quashed by the Supreme Court.
One open question is the extent to which the consumer spending boom of recent years was not merely due to stimulus and catch-up spending, but because people also re-evaluated their lives after the trauma of the pandemic and realized they hadn’t been enjoying themselves enough beforehand. If this is the case, it could warrant structurally higher consumer spending on hobbies and other personal goods and services, though perhaps at the expense of less spending later in retirement.
The long-anticipated recession still refuses to arrive for most countries. A year ago, this revelation would have been a surprise given that many headwinds were set to exert themselves over the intervening 12 months. The U.S. economy continues to hover just above its theoretical stall speed (see next chart).
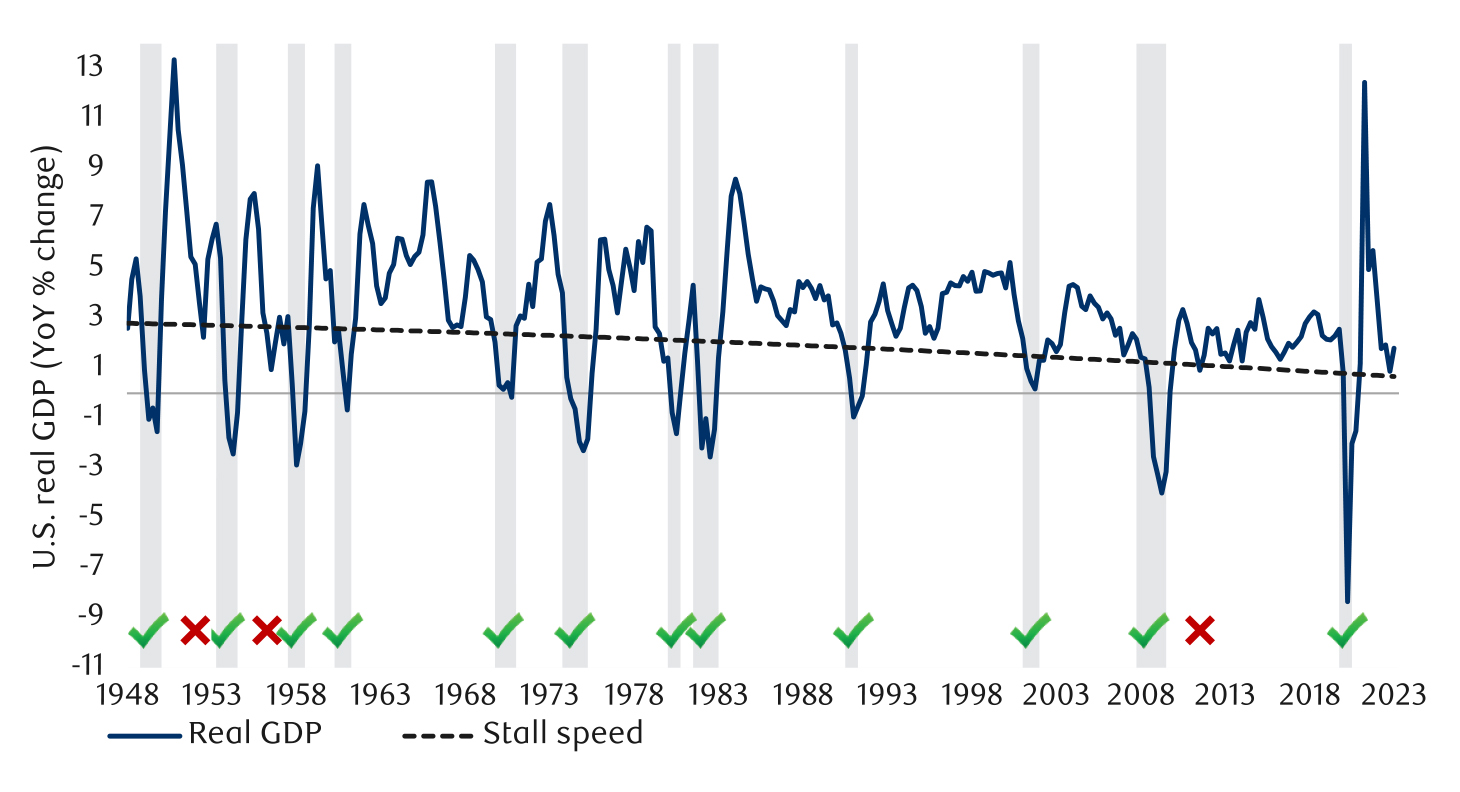
As of Q1 2023. Stall speed calculated as a smoothed function of the Gross Domestic Product trend growth rate minus 1.6 ppt. Shaded area represents recession. Sources: U.S. Bureau of Economic Analysis, Macrobond, RBC GAM
Despite this, we continue to believe a recession is more likely than not, albeit with a probability that we hereby downgrade from 80% to 70%. The reduction reflects the observation that the economy has held on for so long, plus the fact that certain headwinds such as the inflation and energy shock have ebbed considerably in recent quarters.
The recession call itself remains rooted in three things:
Smaller motivations for the recession call include:
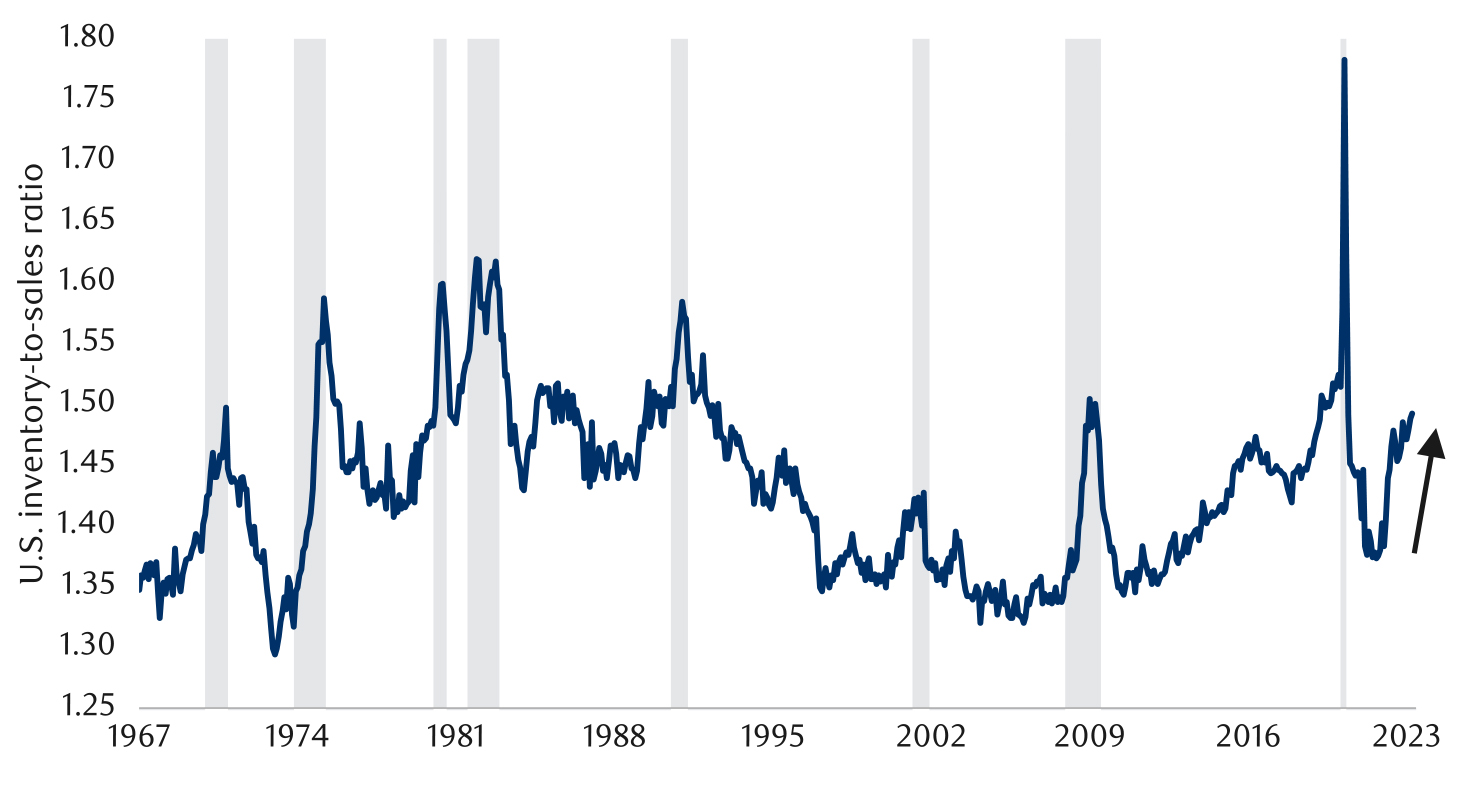
As of March 2023. Real inventory-to-sales ratio of all manufacturing and trade industries. Shaded area represents recession. Sources: U.S. Bureau of Economic Analysis, Haver Analytics, RBC GAM
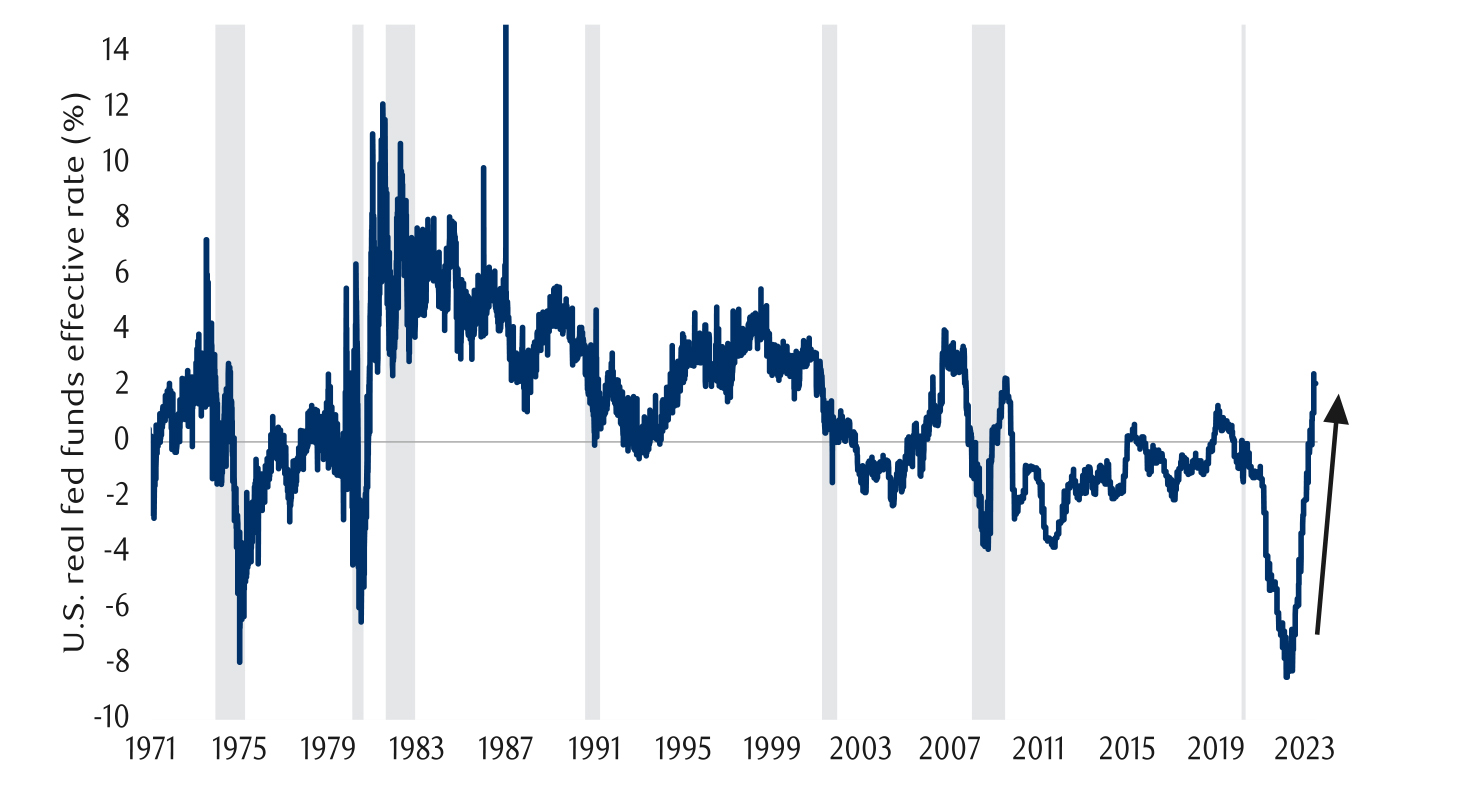
As of 07/17/2023. Shaded area represents recession. Sources: Federal Reserve Board, Macrobond, RBC GAM
Where the recession debate requires the deepest thought is with regard to its timing. We had forecast a recession occurring in the third and fourth quarters of 2023, in large part because the theoretical maximum headwind from interest rates arrives at that time. That’s now. Technically, the window opened several weeks ago, and yet no recession is visible.
Granted, economic data arrives with a lag, and it will be weeks to months before we have a comprehensive picture of July, let alone August and September. And, yes, recessions can start with lightning speed. But, realistically, the probability of this happening in the next month or two is not great. As such, we shift our base-case recession call to the final quarter of 2023 and the first quarter of 2024 while acknowledging there is still a chance that it arrives sooner than that.
Inflation continues to trend nicely lower in most countries. The June decline in the U.S. was especially notable, from +4.0% year-over-year (YoY) to +3.0% YoY in a single swoop. In fairness, most of the decline was due to favourable base effects as the gargantuan price increase from June 2022 fell out of the annual equation. But the latest June print was also genuinely tame, rising by just 0.18% month-over-month (MoM).
More importantly, core inflation – which has declined much less willingly over the past year – rose by just 0.16% MoM. The prior three months had all notched big 0.4% gains, so this core Consumer Price Index (CPI) deceleration was a revelation. It’s the lowest reading in multiple years (see next chart).
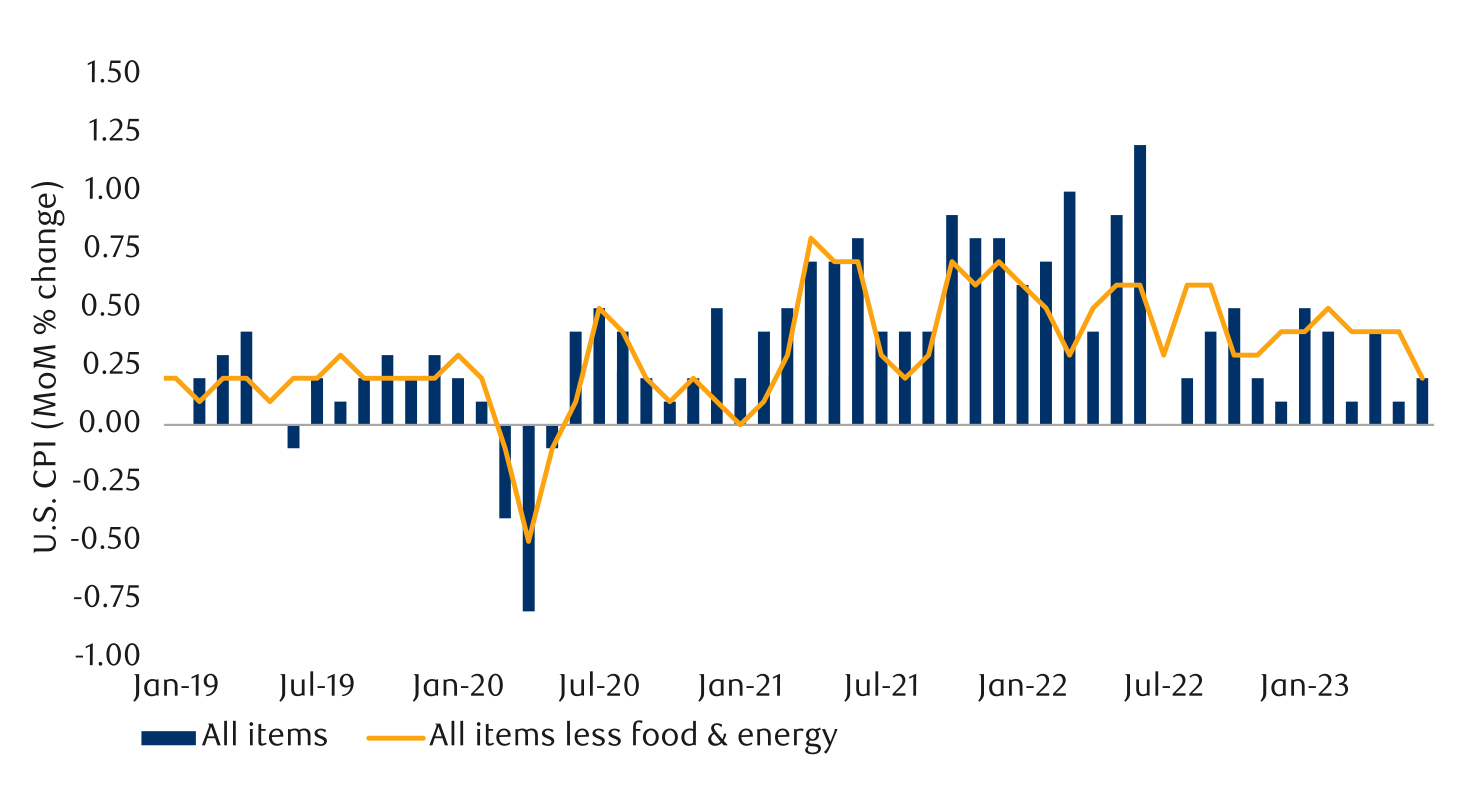
As of June 2023. Sources: U.S. Bureau of Labor Statistics, Macrobond, RBC GAM
Other notable trends:
As of June 2023. Shaded area represents recession. Sources: U.S. Bureau of Labor Statistics, Haver Analytics, Macrobond, RBC GAM
The U.S. Producer Price Index is on the cusp of deflation, now rising just 0.1% YoY (see next chart).
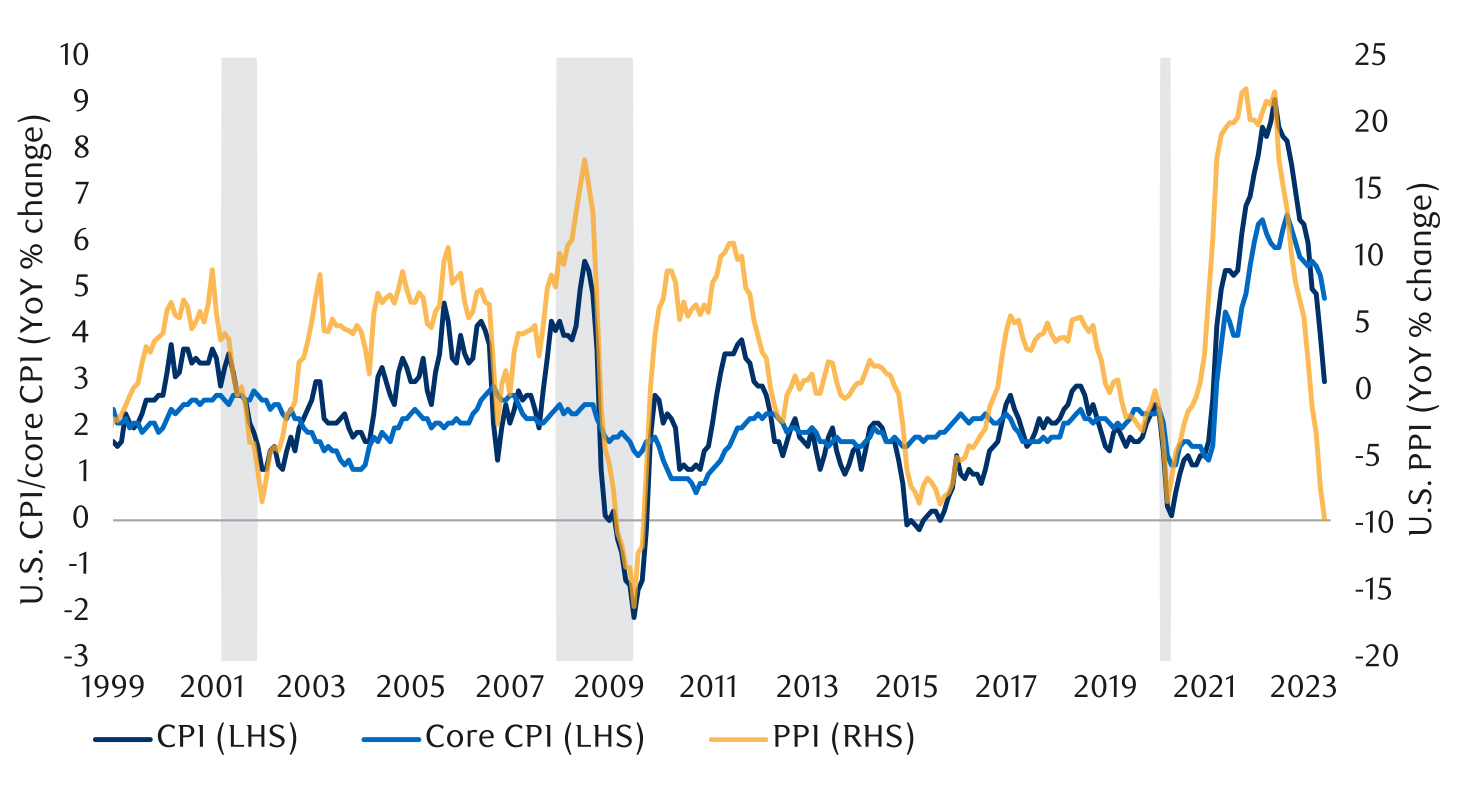
As of June 2023. Shaded area represents recession. Sources: U.S. Bureau of Labor Statistics, Macrobond, RBC GAM
Importantly, the breadth of inflation also continues to narrow. Whereas 33% of the U.S. consumer price basket was rising by 10%-plus per year last September, the latest share is just 8% (see next chart).
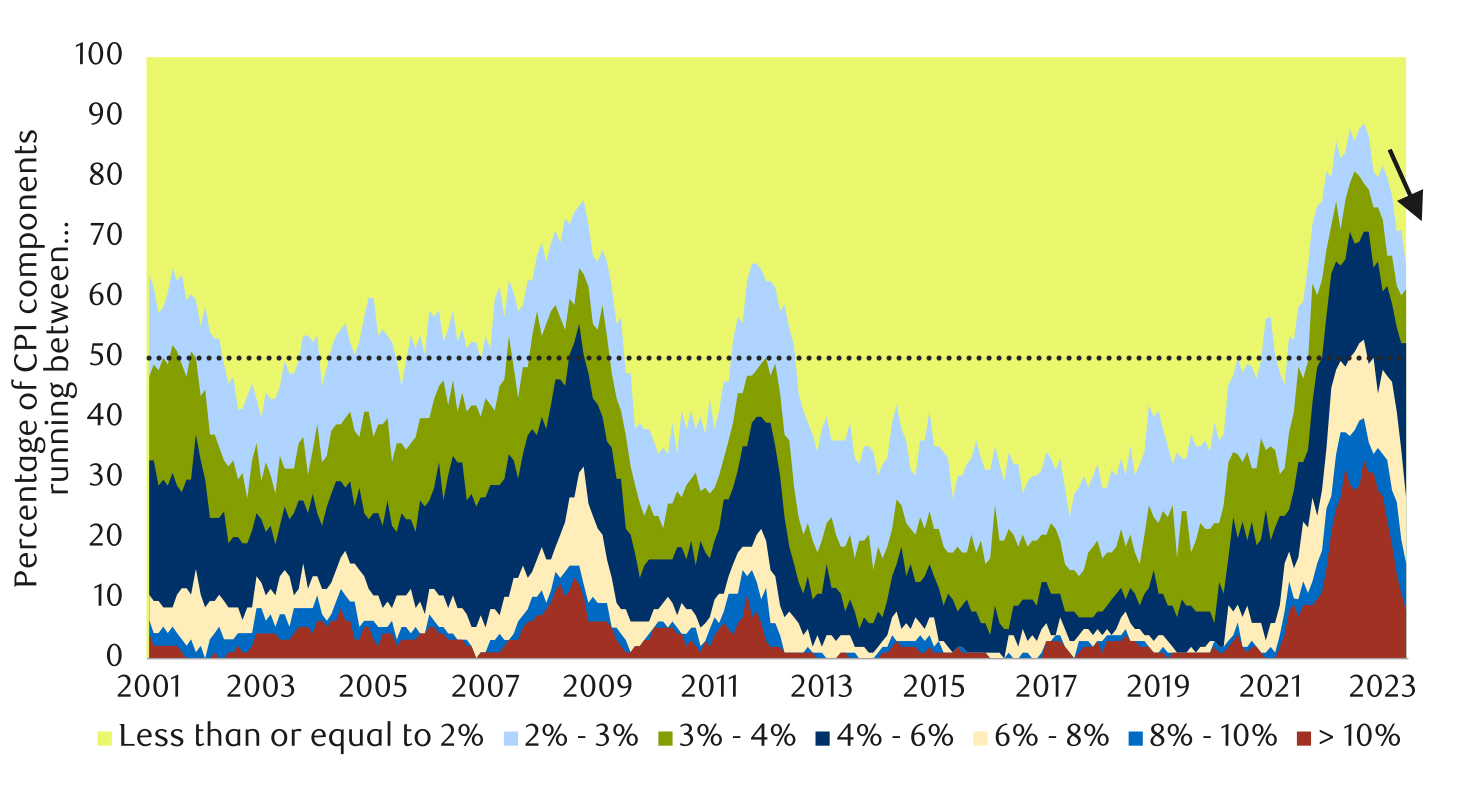
As of June 2023. Share of Consumer Price Index components with year-over-year % change falling within the ranges specified. Sources: Haver Analytics, RBC GAM
It must be conceded that the real-time inflation prints appear to be improving somewhat less quickly in early July relative to the prior few months. However, they are still declining (see next two charts).
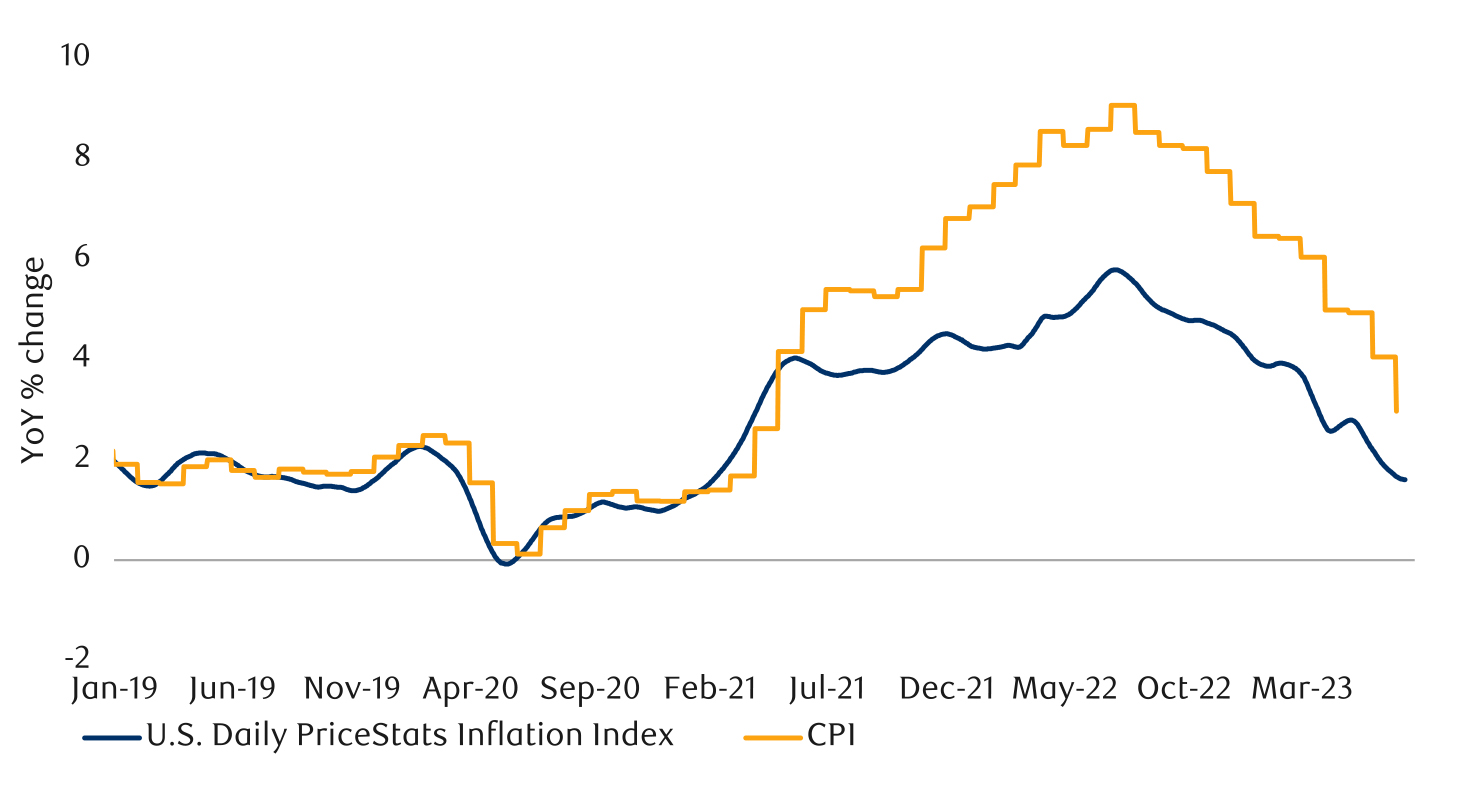
PriceStats Inflation Index as of 07/10/2023, Consumer Price Index as of June 2023. Sources: State Street Global Markets Research, RBC GAM
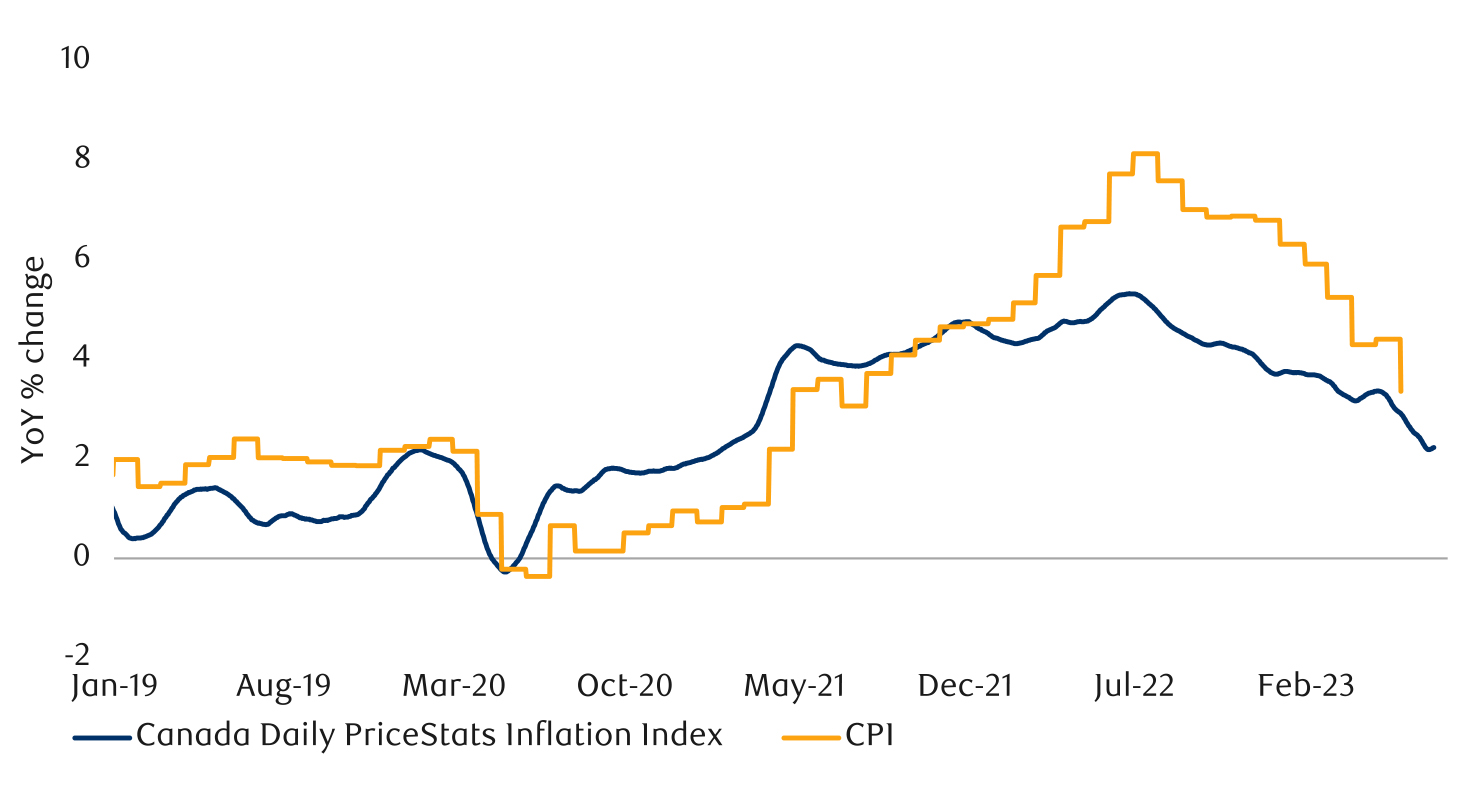
PriceStats inflation index as of 07/10/2023, Consumer Price Index as of May 2023. Sources: State Street Global Markets Research, RBC GAM
In contrast, U.K. inflation is behaving much less well. Wage growth is experiencing a sharp acceleration that may make it difficult to tame inflation without materially tighter monetary policy (see next chart).
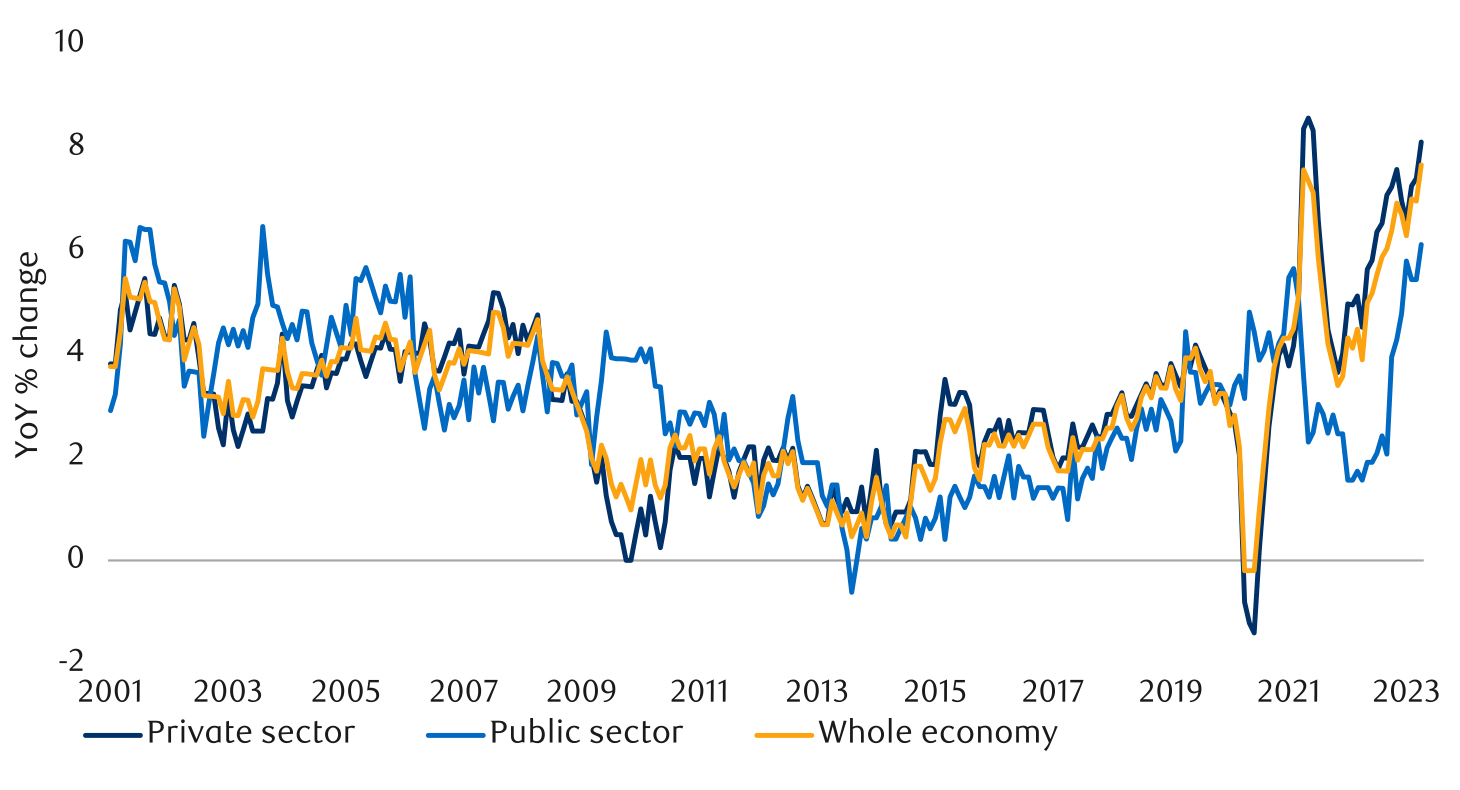
As of April 2023. Sources: U.K. Office of National Statistics, Macrobond, RBC GAM
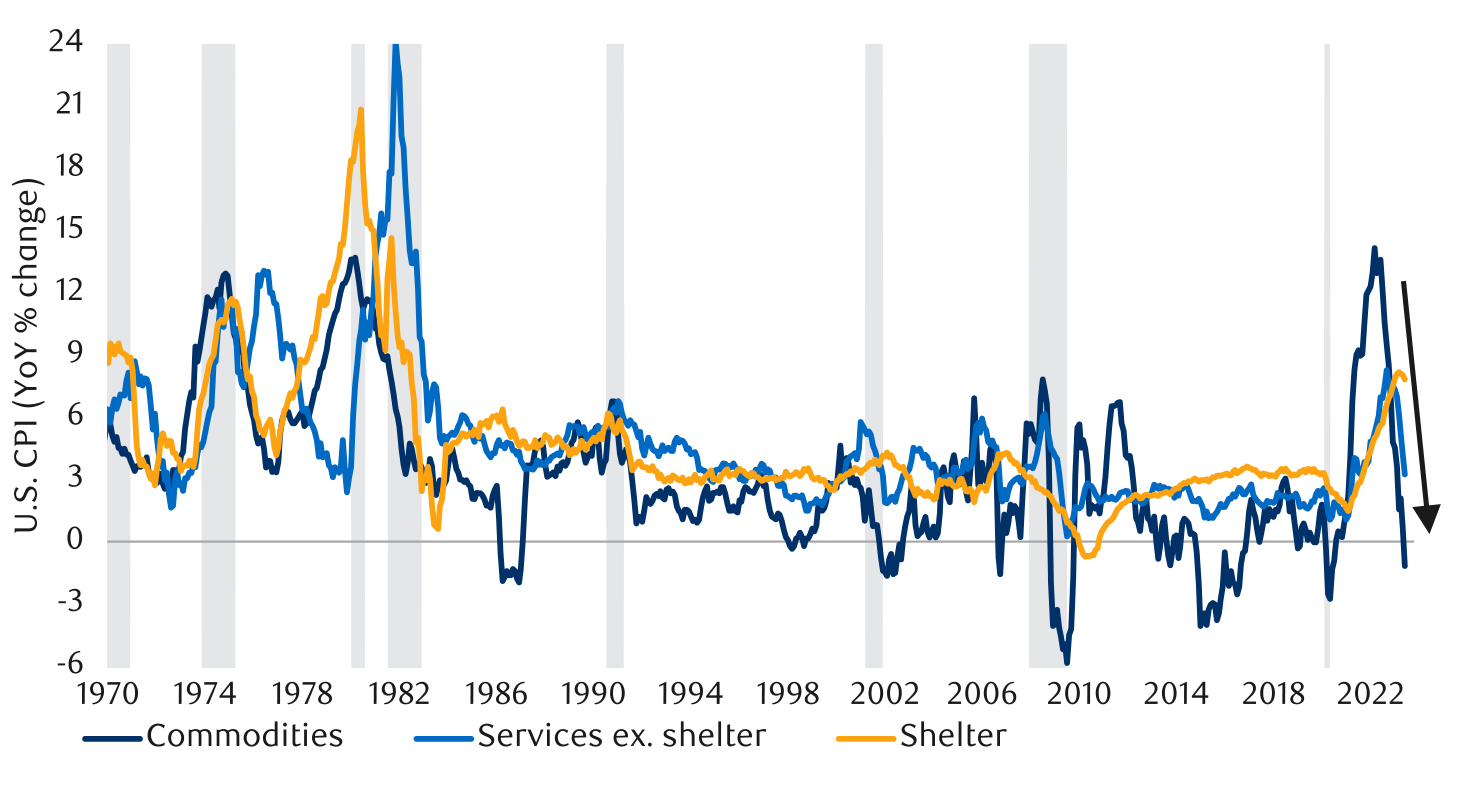
Headline inflation has improved a lot. But it arguably exaggerates the sustainability of the inflation improvement. Gasoline prices have fallen sharply over the past year, helping a great deal. But this trend is unlikely to continue declining indefinitely. Whereas overall U.S. inflation is just 3.0% YoY, inflation excluding motor fuel is still 5.3% YoY (see next chart). Inflation without the artificial helping hand of gasoline deflation is still three-plus percentage points from normal. Inflation still has a fair distance left to travel.
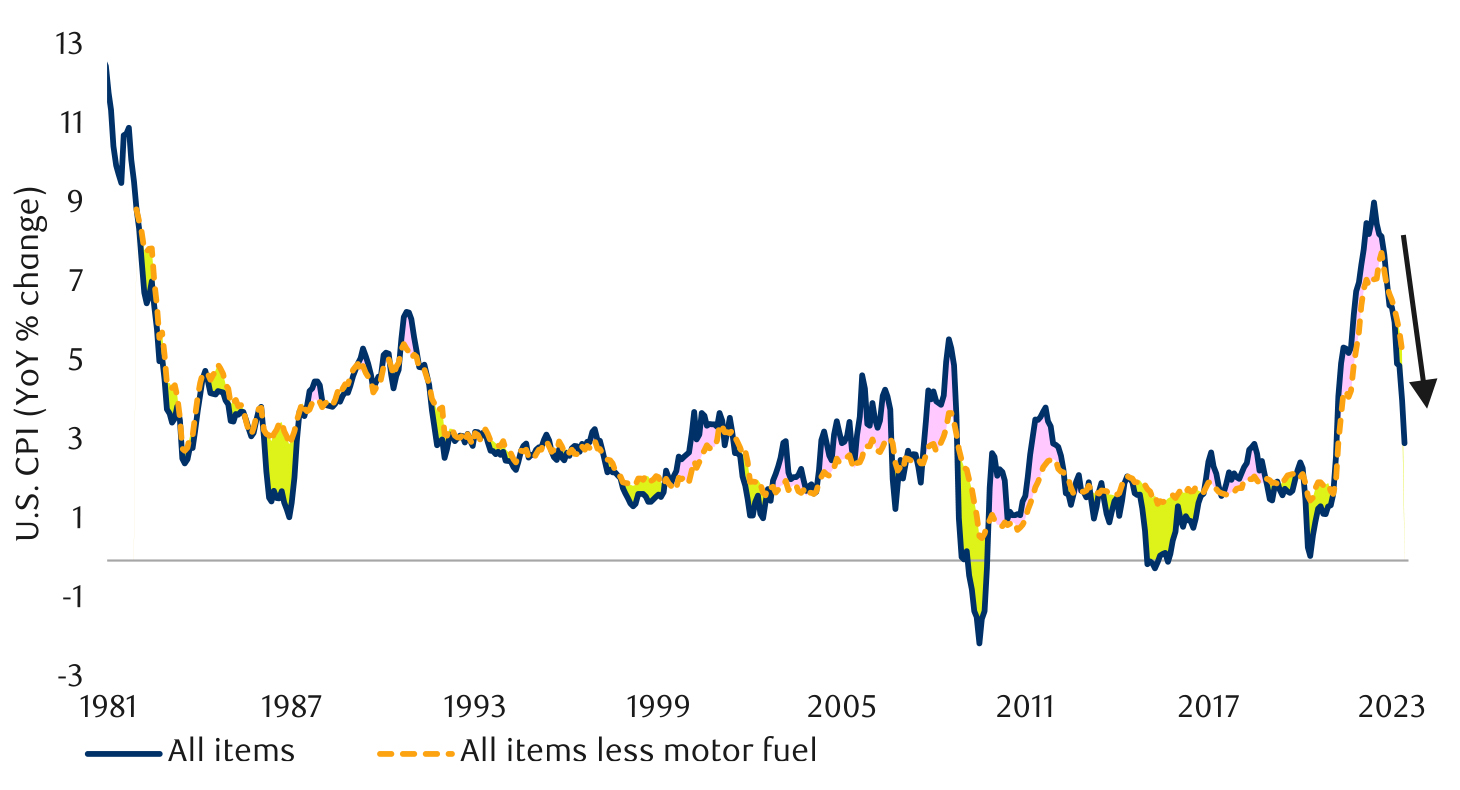
As of June 2023. Shaded area represents recession. Sources: U.S. Bureau of Labor Statistics, Haver Analytics, Macrobond, RBC GAM
It is no longer likely that inflation gets stuck at 10%, but as an upside risk it remains possible that inflation gets stuck in the 4-5% range. (For the record, our base-case forecast is that inflation returns to the mid-2s.)
At the opposite extreme, it remains somewhat of a stretch to think that deflation represents a serious risk. However, it is always worth appreciating that there is a real scenario in which inflation arrives materially below consensus. Monetary policy has pivoted from extreme stimulus to substantial restraint, commodity prices have fallen significantly, supply chain problems are mostly resolved and a recession may be in the offing.
Prices rose too much for some products for varying reasons: raw materials were temporarily more expensive, there were shortages, and/or market conditions enabled profit margins to expand. Some of these drivers can reverse, not merely stop. At the corporate level, some companies such as Whole Foods and Walmart are reportedly putting pressure on their suppliers – a potentially deflationary impulse. Car prices are again falling after massive earlier increases. Computer chip prices continue to trend lower after their earlier spike (see next chart).
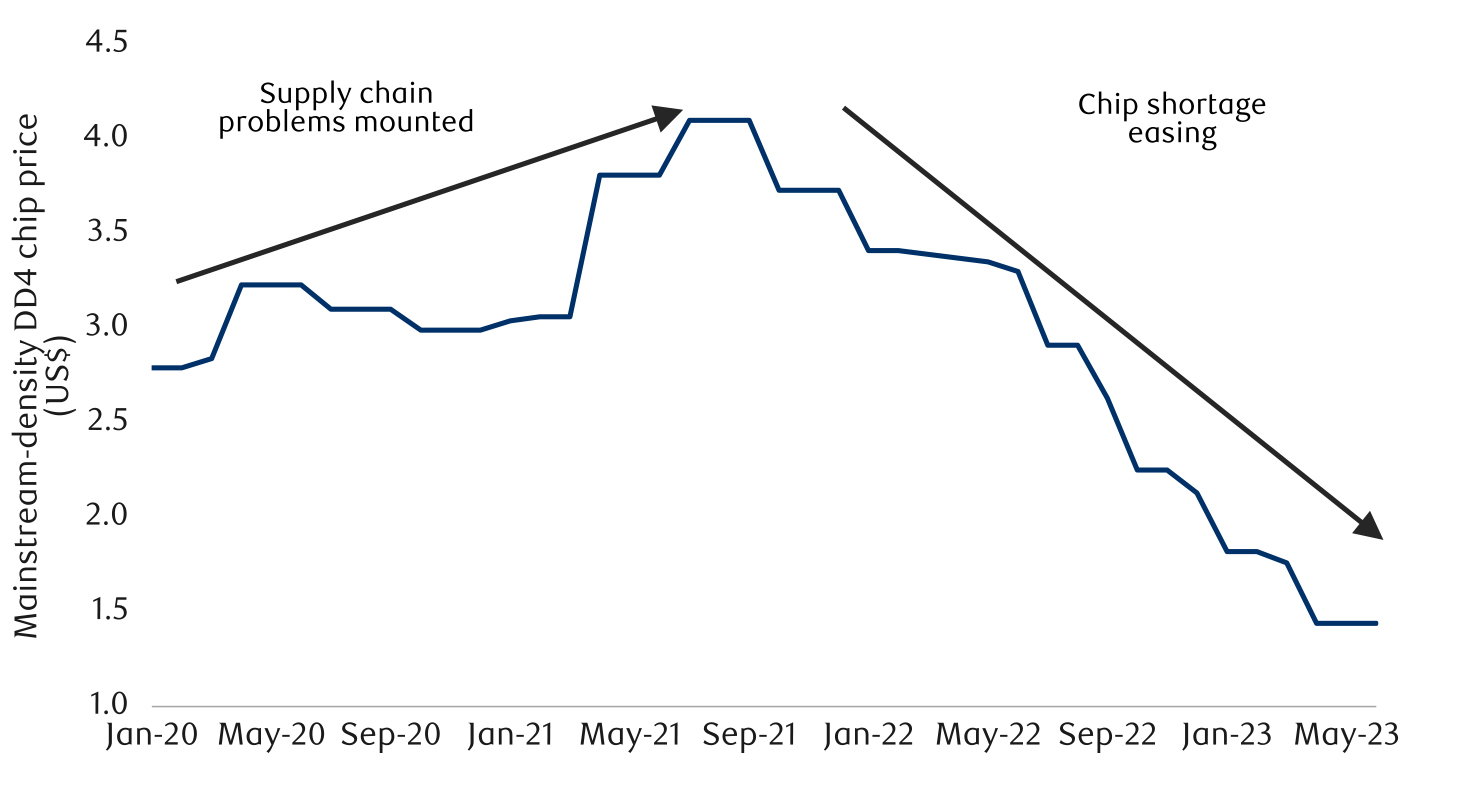
As of June 2023. Mainstream density DDR4 chip used in the DDR4 8GB 1Gx8 2400/2666 MHz chip. Sources: InSpectrum Tech, BloomBerg
At the international level, two countries illustrate the downside inflation risk. The first is Spain, which now reports just +1.9% CPI YoY, slightly below the European Central Bank’s (ECB) 2.0% target. Amazingly, this is less than a third of the German inflation reading.
What can possibly explain this remarkable softness? It is a mix of economic conditions, structural factors and government policy. Spain brandishes the highest unemployment rate in the European Union (EU), limiting capacity-oriented pressures. The main structural factor is that the Spanish natural gas network is less integrated with the rest of the EU than its peers. This means that the country’s energy costs did not skyrocket to the same extent as Russia cut off access.
Helpful government policies have included a gas price cap, a sales tax cut for fruit and vegetables, and new rent controls limiting increases to 3% per year. (It should be noted that while these policies have helped to limit inflation in the short run, they are not necessarily economically optimal over the long run.)
The second country is China, which now reports a CPI rate of 0.0% YoY, and whose Producer Price Index fell by 5.4% over the past year. China is quite different than other countries. It never had much of an initial inflation spike, in large part because it didn’t deliver the sort of pandemic stimulus that other countries did. Also, as the point of origin for many supply chains, China’s own supply chain woes were considerably tamer than most. In addition, because its economy was more open than most across the bulk of the pandemic, there wasn’t a mad scramble to spend as restrictions faded.
Conversely, you could argue that China is simply on a lagged timeline relative to other countries. It reopened just seven months ago, and so could be about to experience a surge in inflation with the same one-year lag after reopening that other countries have. If this line of thinking were to prove correct, China could encounter considerably more inflation next year. But without the jostling of other countries simultaneously reopening and with an economy that is relatively weak, Chinese inflation is likely to remain relatively controlled.
The circumstances of Spain and China are sufficiently distinct that they don’t provide a particularly helpful roadmap for other countries seeking to escape inflation. But they do illustrate that it is entirely possible for inflation to be normal or even low in the present environment. Some countries are likely to join them, and inflation could undershoot expectations more broadly.
Central banks are on track to deliver more monetary tightening than had been imagined just a quarter ago. The Bank of Canada is already up to a 5.00% overnight rate, beyond its previously planned 4.50% ceiling. The U.S. Federal Reserve appears to have at least one more hike ahead, also beyond earlier expectations.
To put it simply, if the most interest-rate sensitive sector of the economy – housing – is reviving at a time when the economy is already too hot, then interest rates simply aren’t high enough to achieve the goal of normal inflation.
But after the soft U.S. inflation report came out last week, market expectations have dipped somewhat. The Fed is expected to stop after that next 25bps move, and the market now assumes that the Bank of England will halt around 6% rather than 6.5%.
Will this last tightening of the screws prove especially potent? Economic theory generally argues that every 25 basis point rate hike has about the same dampening influence on the economy. As such, an extra 50 basis points or so of monetary tightening is hardly a big deal. But, with all due respect to the economic models, one can mount a reasonable argument that this latest tightening is perhaps slightly more potent than usual:
A final thought on central banks: emerging market central banks should be heeded. They led the way higher, recognizing far sooner than developed nations that higher inflation had to be combatted and undertaking serious monetary tightening a full year earlier. Emerging market nations are hyper-sensitive to inflation as they have much less well anchored expectations, a larger share of their price basket is composed of volatile commodity prices, and central banks must also worry about capital outflows.
These same emerging market central banks could now act as a leading indicator for developed world central banks in the opposite direction. China has already cut rates, though it admittedly marches to its own drummer. Tongues are wagging about other Asian giants such as India, South Korea and possibly Indonesia cutting interest rates this fall. Brazil could cut its policy rate as soon as August. Developed nations are probably not cutting rates until 2024, with advanced warning potentially coming from the emerging market space.
There is the impression that society is decaying all around us, with possible relevance for the sustainability of economic growth over the long run. We first tackled this subject late last year, in a section called “Society in decline?”
Our conclusion was less apocalyptic than feared. Using U.S. data, some aspects of society did show mounting problems. For example, overdose deaths are rising, prominently. But other social trends are more positive:
Over the intervening months we have constructed additional societal barometers that provide further insight. They also point to a nuanced conclusion.
Let us start with the bad news. The share of the U.S. population with obesity continues to rise, at least through the 2019 data publicly available (see next chart). This has negative effects on quality of life and longevity, among other implications.
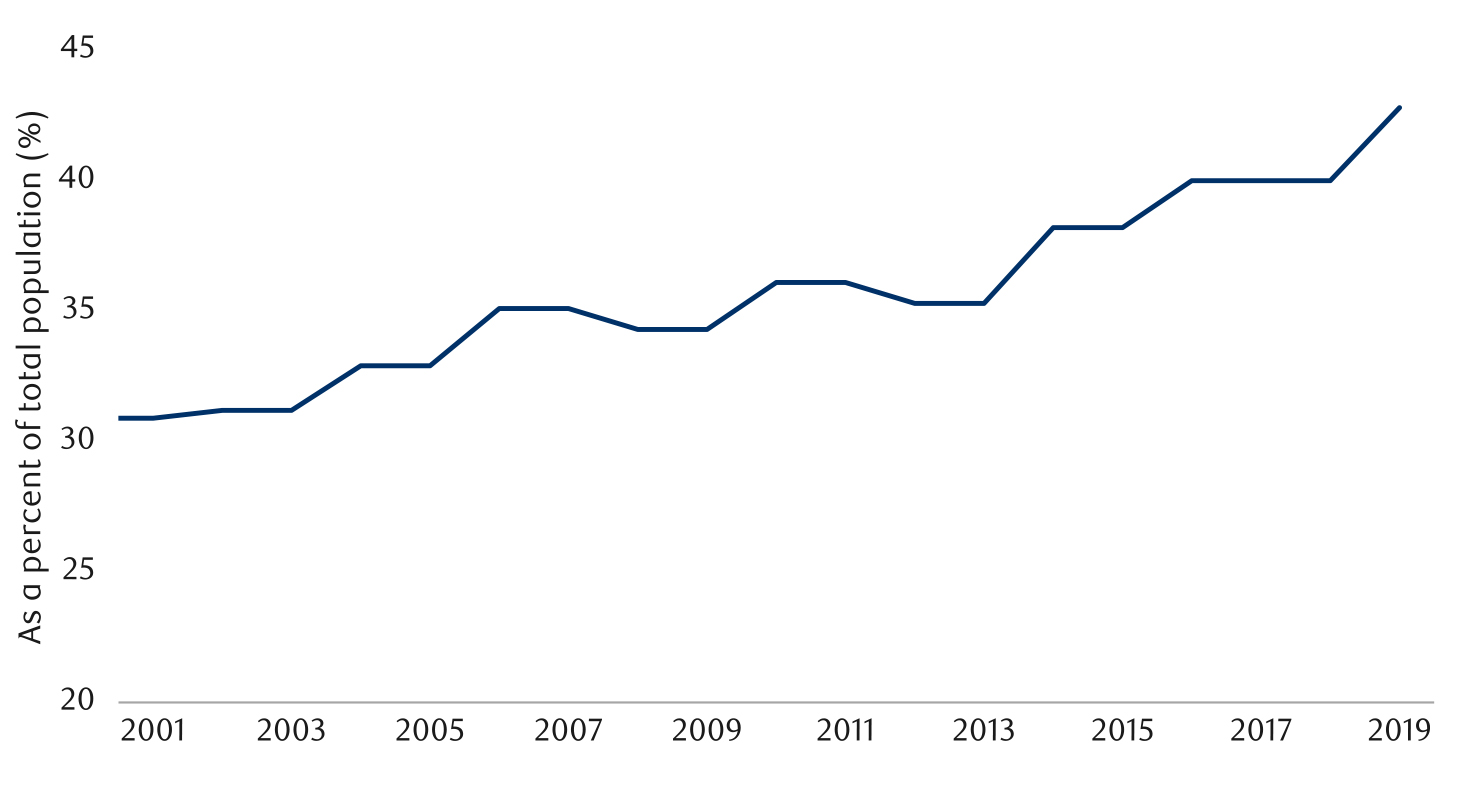
As of 2019. Sources: Organization for Economic Co-operation & Development (OECD), Macrobond, RBC GAM
Tragically, the suicide rate has been rising for several decades. Incidentally, and not taking away from this longer-term upward trend, it is surprising that the suicide rate fell to an unusually low level in 2020 during the most stressful phase of the pandemic. It was still no higher than the pre-pandemic norm in the most recent year (2021).
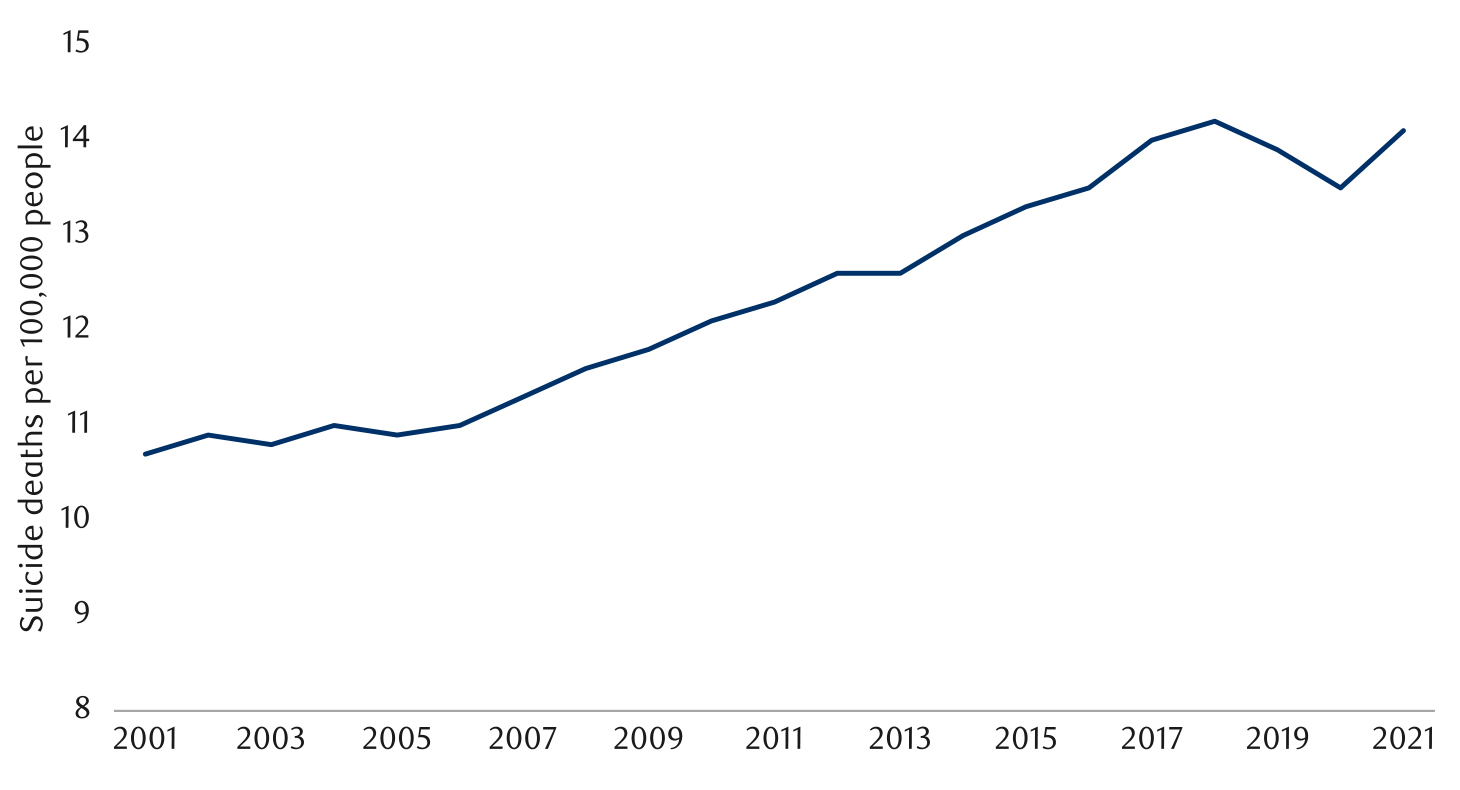
As of 2021. Sources: Centers for Disease Control & Prevention, National Vital Statistics System (NVSS), RBC GAM
The fraction of the U.S. population with a disability continues to rise (see next chart). But this isn’t actually as bad as it looks. Census Bureau research finds that the increase is much less prominent (or even non-existent) if one controls for the rising age of the average American.
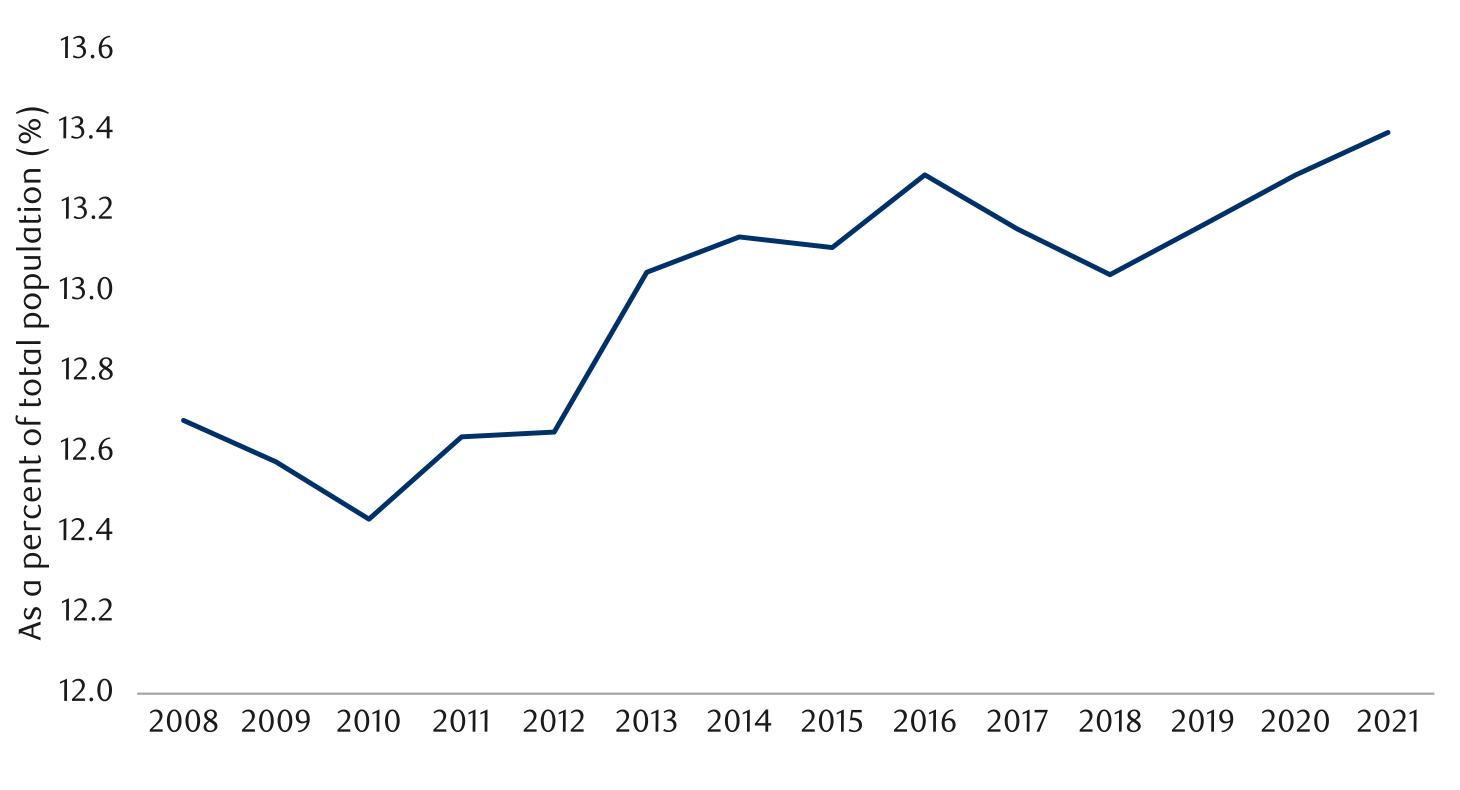
As of 2021. Sources: National Institute on Disability, Independent Living and Rehabilitation Research, Macrobond
Surprisingly, and now pointing in a more optimistic direction, mental health disorders have actually been in decline since the turn of the millennium (see next chart). It is fair to concede that they were beginning to rise when the latest data was released in 2019, but not to the point of annulling earlier gains. It is admittedly perplexing that mental health disorders were declining while the suicide rate was rising across the 2010s.
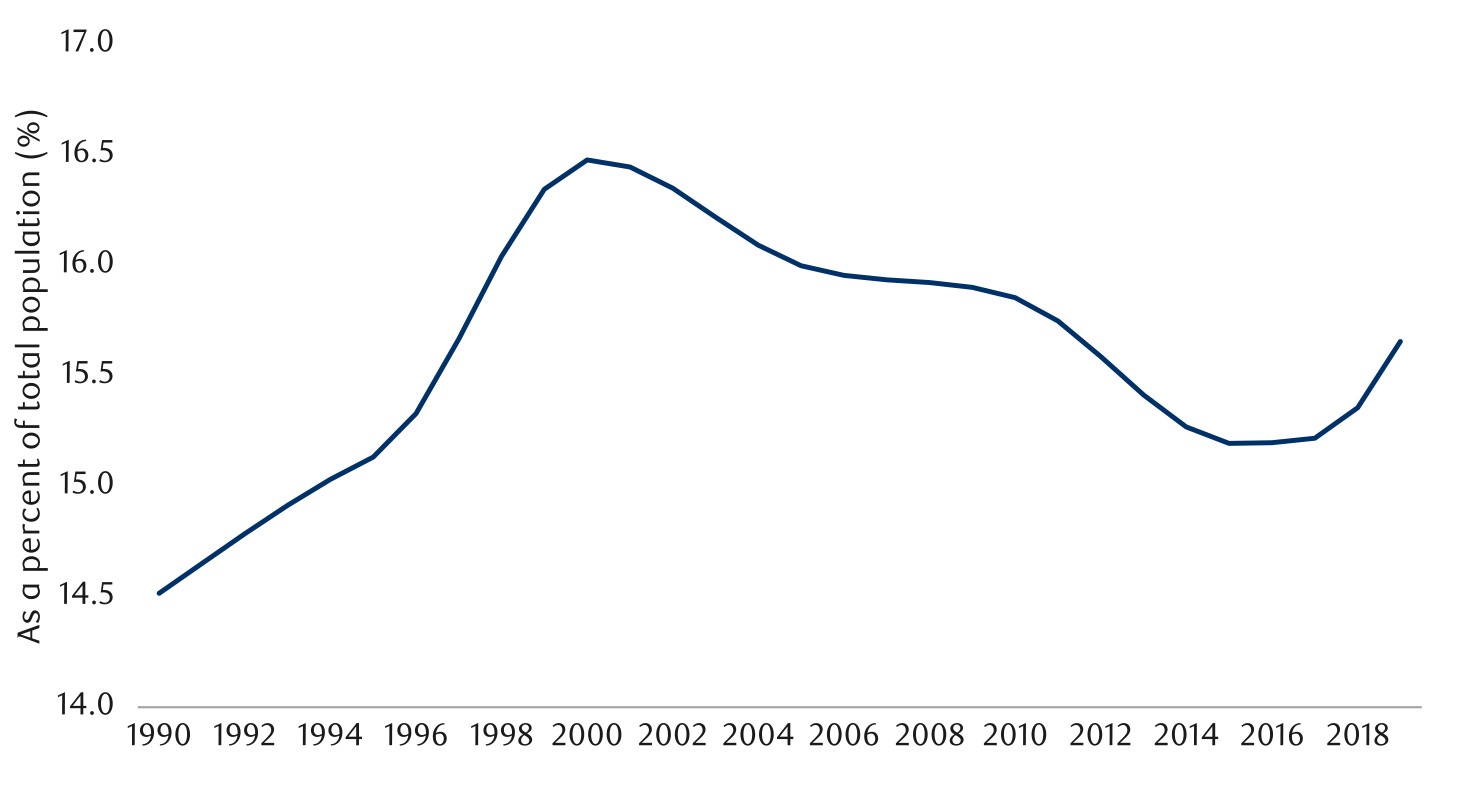
As of 2019. Mental health disorder includes depression, anxiety, bipolar, eating disorder and schizophrenia. Sources: Institute for Health Metrics & Evaluation, Global Burden of Disease, Our World in Data, RBC GAM
Lastly, educational attainment continues to rise at an impressive clip (see next chart). There are far more high school graduates than even a decade ago. The same goes for post-secondary graduates. Pessimists will note that the quality of that education has been in relative decline, but overall it is safe to conclude that human capital is rising rather than falling.
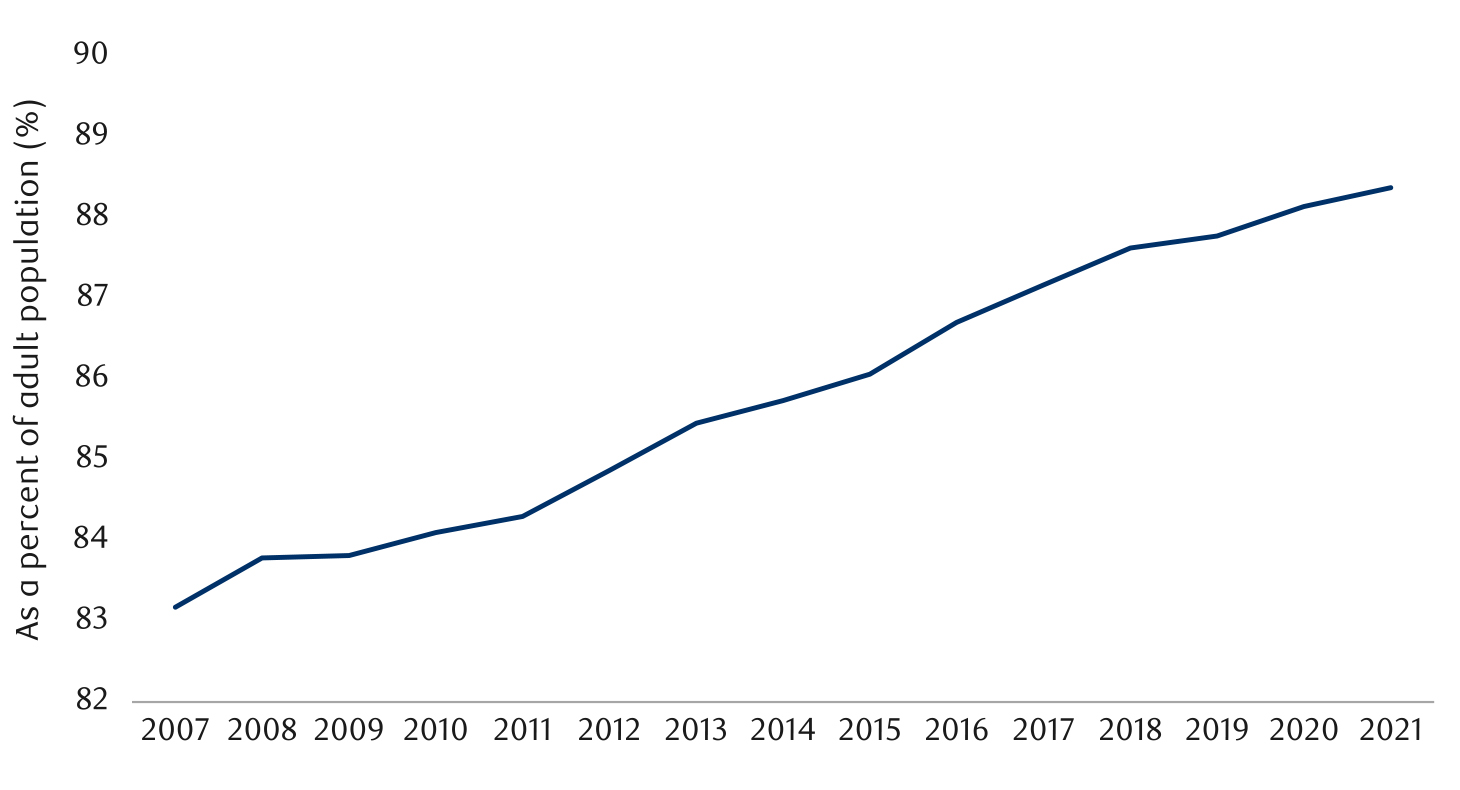
As of 2021. Source: U.S. Census Bureau, Macrobond, RBC GAM
There is no easy way to quantify the relative importance of obesity versus education, or the suicide rate versus the crime rate. The best we can do is to acknowledge that some non-economic societal markers are most certainly getting worse, while some are getting better. The latest set of indicators tilt a bit more toward the negative, but the earlier set of indicators published in December tilted more toward the positive. Nearly all are nuanced.
Certainly there is room for improvement and there are many ills to be addressed. But, despite the popular impression, western society is not actually circling the drain in every way.
-With contributions from Vivien Lee, Thao Le and Aaron Ma
Subscribe now to receive the latest investment and economic insights from our experts, sent straight to your inbox.
This document is a marketing communication and it may be produced and issued by the following entities: in the European Economic Area (EEA), by BlueBay Funds Management Company S.A. (BBFM S.A.), which is regulated by the Commission de Surveillance du Secteur Financier (CSSF). In Germany, Italy, Spain and Netherlands the BBFM S.A is operating under a branch passport pursuant to the Undertakings for Collective Investment in Transferable Securities Directive (2009/65/EC) and the Alternative Investment Fund Managers Directive (2011/61/EU). In the United Kingdom (UK) by RBC Global Asset Management (UK) Limited (RBC GAM UK), which is authorised and regulated by the UK Financial Conduct Authority (FCA), registered with the US Securities and Exchange Commission (SEC) and a member of the National Futures Association (NFA) as authorised by the US Commodity Futures Trading Commission (CFTC). In Switzerland, by BlueBay Asset Management AG where the Representative and Paying Agent is BNP Paribas Securities Services, Paris, succursale de Zurich, Selnaustrasse 16, 8002 Zurich, Switzerland. The place of performance is at the registered office of the Representative. The courts at the registered office of the Swiss representative or at the registered office or place of residence of the investor shall have jurisdiction pertaining to claims in connection with the offering and/or advertising of shares in Switzerland. The Prospectus, the Key Investor Information Documents (KIIDs), the Packaged Retail and Insurance-based Investment Products - Key Information Documents (PRIIPs KID), where applicable, the Articles of Incorporation and any other document required, such as the Annual and Semi-Annual Reports, may be obtained free of charge from the Representative in Switzerland. In Japan, by BlueBay Asset Management International Limited which is registered with the Kanto Local Finance Bureau of Ministry of Finance, Japan. In Asia, by RBC Global Asset Management (Asia) Limited, which is registered with the Securities and Futures Commission (SFC) in Hong Kong. In Australia, RBC GAM UK is exempt from the requirement to hold an Australian financial services license under the Corporations Act in respect of financial services as it is regulated by the FCA under the laws of the UK which differ from Australian laws. In Canada, by RBC Global Asset Management Inc. (including PH&N Institutional) which is regulated by each provincial and territorial securities commission with which it is registered. RBC GAM UK is not registered under securities laws and is relying on the international dealer exemption under applicable provincial securities legislation, which permits RBC GAM UK to carry out certain specified dealer activities for those Canadian residents that qualify as "a Canadian permitted client”, as such term is defined under applicable securities legislation. In the United States, by RBC Global Asset Management (U.S.) Inc. ("RBC GAM-US"), an SEC registered investment adviser. The entities noted above are collectively referred to as “RBC BlueBay” within this document. The registrations and memberships noted should not be interpreted as an endorsement or approval of RBC BlueBay by the respective licensing or registering authorities. Not all products, services or investments described herein are available in all jurisdictions and some are available on a limited basis only, due to local regulatory and legal requirements.
This document is intended only for “Professional Clients” and “Eligible Counterparties” (as defined by the Markets in Financial Instruments Directive (“MiFID”) or the FCA); or in Switzerland for “Qualified Investors”, as defined in Article 10 of the Swiss Collective Investment Schemes Act and its implementing ordinance, or in the US by “Accredited Investors” (as defined in the Securities Act of 1933) or “Qualified Purchasers” (as defined in the Investment Company Act of 1940) as applicable and should not be relied upon by any other category of customer.
Unless otherwise stated, all data has been sourced by RBC BlueBay. To the best of RBC BlueBay’s knowledge and belief this document is true and accurate at the date hereof. RBC BlueBay makes no express or implied warranties or representations with respect to the information contained in this document and hereby expressly disclaim all warranties of accuracy, completeness or fitness for a particular purpose. Opinions and estimates constitute our judgment and are subject to change without notice. RBC BlueBay does not provide investment or other advice and nothing in this document constitutes any advice, nor should be interpreted as such. This document does not constitute an offer to sell or the solicitation of an offer to purchase any security or investment product in any jurisdiction and is for information purposes only.
No part of this document may be reproduced, redistributed or passed on, directly or indirectly, to any other person or published, in whole or in part, for any purpose in any manner without the prior written permission of RBC BlueBay. Copyright 2023 © RBC BlueBay. RBC Global Asset Management (RBC GAM) is the asset management division of Royal Bank of Canada (RBC) which includes RBC Global Asset Management (U.S.) Inc. (RBC GAM-US), RBC Global Asset Management Inc., RBC Global Asset Management (UK) Limited and RBC Global Asset Management (Asia) Limited, which are separate, but affiliated corporate entities. ® / Registered trademark(s) of Royal Bank of Canada and BlueBay Asset Management (Services) Ltd. Used under licence. BlueBay Funds Management Company S.A., registered office 4, Boulevard Royal L-2449 Luxembourg, company registered in Luxembourg number B88445. RBC Global Asset Management (UK) Limited, registered office 100 Bishopsgate, London EC2N 4AA, registered in England and Wales number 03647343. All rights reserved.
Subscribe now to receive the latest investment and economic insights from our experts, sent straight to your inbox.
Please choose from the following
We are unable to market if your country is not listed.
You may only access the public pages of our website.